The Statistical Validity of "Veteran Presence" in the NBA
- Bruin Sports Analytics

- Mar 28, 2022
- 14 min read
By: Anthony Rio and Kyle Ritscher
Introduction
Veteran presence is a frequently used term referring to the impact that veteran players have on a team, whether that be on or off the court. Generally, it is assumed that veterans are both more effective on the court themselves, and that their teammates feed off of their knowledge and individually improve. However, veteran presence can look different depending on the player. For example, 20 year tenured Miami Heat big man Udonis Haslem brings toughness, knowledge, and leadership, but close to zero on-court individual impact. Conversely, Warrior’s 10th year forward Draymond Green’s veteran savvy is not just his wealth of knowledge and leadership, but also his generation ability and IQ on the defensive end that only has grown over his career. Green’s defensive wizardry and unorthodox help-rotations cover up the mistakes of teammates and anchor his team’s defensive units, vaulting them into the upper echelon of the league year in and year out. In Green’s case, his veteran presence is not only helping improve other teammates in the long-run, but also making a very tangible impact on the court in the present.
Chris Paul’s veteran presence was visible even for opposing players. Jayson Tatum explains how he learned about what a “3 for 2” was recently from playing against Chris Paul, despite playing basketball for nearly two decades. The “3 for 2” is a strategy to shoot the ball with 63-65 seconds left in a quarter to ensure that your team will be able to execute a “2 for 1” and thus guarantee themselves the advantage of having one extra possession and scoring opportunity to end the quarter. This situation isn’t exclusive to Chris Paul and Jayson Tatum; older players pass down gems of knowledge regularly. This could be giving a tip about how to improve the body recovery processes, pointing out a tendency of the opposition, demonstrating how to position oneself in certain defensive situations, or just improving a younger player's knowledge of the game. These little things enhance the IQ, development, work ethic, and play of the next generation, and are certainly an aspect of veteran presence.
We chose to dive deeper into this concept, asking whether veteran presence is something that can be measured statistically. We analyzed the effect of individual players' experience on their team's performance using both individually measured statistics (WS, BPM, etc.) and team statistics (Net Rating, Wins). Additionally, we considered the average experience on a team in relation to that team’s success, which allows for deeper insight into the nature of this phenomenon.
However, we are only looking at this statistical validity in the short term. This does leave a lot of interesting questions on the table: do younger players improve faster with veterans on the roster to lead? Do franchises with many veterans in one year struggle in years going forward? Regardless of how interesting these questions may be, and how relevant they may be to a discussion of veteran presence, they are not ones we chose to analyze in this paper. Draymond Green or Chris Paul passing on knowledge to their team will only be relevant here if their team played better or differently that year. Let us see if they did.
Data
Our data is all for the 2018-2019 season, and was imported from bballrefrence.com. We have one dataset for player performance metrics (BPM, Win Shares, etc.) and another for team performance metrics^ (Wins, Net Rating, etc.) We used the NBA 2K20 dataset from kaggle to assess player ratings and their draft year. The people in the video game world already developed a single metric to evaluate a player’s overall talent, which we decided was trustworthy enough to use.
This may seem to be a glaring issue of mismatched years: 2K20, 18-19 season. However, 2K20 has ratings assigned based on performance in the 18-19 season, so choosing the 18-19 season makes the most sense*. It also allowed us to avoid the COVID-19 bubble year.
Metrics
While college experience is certainly valuable, we want to restrict the veteran notion to exclusively NBA tenure. Just using age would weigh all forms of basketball equally. So, players are classified by the number of seasons since their draft year˚, which is notated as experience. We also added metrics “average roster experience” (AER) and “average experience on the floor” (AEF). Average roster experience is simply the mean experience of the players on the team. Average experience on the floor is a team experience statistic weighted by the amount of minutes each player played. Note that both of these statistics soley took into account players who only played on one team during the 2018-2019 NBA season.
Regarding metrics from basketballrefrence.com, we are using Offensive Box Plus Minus (OBPM), Defensive Box Plus Minus (DBPM), Box Plus Minus (BPM), Win Shares (WS), Win Shares per 48 minutes(WS.48), Value Over Replacement (VORP), True Shooting Percentage (TSP), and Player Efficiency Rating (PER) to measure individual player success. We chose many of these metrics over common box score statistics like points because these metrics are more connected to the team's success. We do also consider a players’ team’s wins and mean net ratings. For teams as a whole we consider their wins and net ratings, as well as other more explanatory metrics, like team and opponent shot locations.
Analysis
First, we conducted analysis on the correlation between experience and various success metrics. The graph below plots the regression lines of 10 different metrics after normalizing the data (i.e. each metric evaluated on a scale of 0 to 1).

Each line itself is not as important as the trends of them altogether: among any performance metric, the correlation with experience is at least slightly positive. The individual metrics have low r-squared values, and the team metrics even lower, but this is to be expected. Success in basketball can be attributed to many factors, and experience is surely not one of the top ones. Still, we see that while the correlation is weak, all the regression lines clearly demonstrate that success is positively correlated with experience.
Furthermore, we look at our average experience per minute on the court metrics, and we see similar results. Teams with more experienced players playing more minutes tend to win more games and have better net ratings. In tandem with in-depth player analysis, these visualizations may be redundant; if experienced players perform better, of course teams with more experienced players perform better. However, they offer simple support to the trends above and are worth including.


Now, we want to mention that these results make intuitive sense. With experience often comes comfortability, confidence, knowledge, and, at the very least, basic incremental improvement over a player's time in the NBA. These attributes, to some extent, contribute to success.
However, while the first three aspects above fit in our definition of veteran presence, the last does not. In fact, this improvement with age is a massive confounding factor in our analysis above. To demonstrate this point, we look at the relationship between a player's experience and their NBA 2K rating.

There is a strong positive correlation in years of experience and player 2k rating. So, in general, older players are mostly better players, and thus their teams tend to have better statistics because of the higher individual player ratings. We already addressed one possible reason for this correlation, being that players will get better with age. A second reason for this is that in the NBA, team executives are far more willing to take chances on rostering younger players with less talent (and lower “2k ratings”) than they would be with older players. This is a result of teams seeing less experienced players as blossoming assets, who are still improving in a pre-prime stage of their career. Conversely, veterans are often in their prime or past it with very little likelihood to improve and become a more talented player as their body physically declines. Thus, on NBA rosters, there are a greater number of low rated inexperienced players than low rated veterans. So, with such a dramatic correlation between ratings and experience, all of our analysis we just did to evaluate veteran presence is lost in the confounding factor.
The best way to address confounding factors is always with an experiment, where we can manually control for them. Sadly, we cannot manually assign players to different teams before the season and then collect data at the end, so an experiment is off the table. Instead, we look to methods of controlling confounding factors that work after collecting data. One of these methods is a process called stratification, where you fix the level of the confounders and conduct analysis within the groups, where the confounder doesn’t vary. If the results of analysis within the groups are dramatically different than the overall analysis, then we know the confounding factor played a major role in the general associations.
In practice, our strata were different ratings groups. Most of the time using quartiles for numeric data makes the most sense, but the distribution of ratings in the NBA is very non-uniform (see plot below). Our top quartile would have had a range of 18. For reference, ratings only have an overall range of 30. On the other hand, if each group had the same range, our top groups would have barely any players. We chose to make five groups, with the goal of keeping the range as small as possible for the top groups, while still having enough players to make analysis worthwhile. Our cutoffs were 72, 75, 78, and 84, inclusive. The only fault is our top group still has a wide range of 13, but going smaller just simply left the group without enough players.

First, we point out that the sorting was both effective and necessary with a few graphics exploring our data after stratification. We see the clear increasing nature of the variables as the level of our strata increases.


So, our splitting should have accounted for the differences in talent associated with ratings. Leftover correlation between experience and success within each group should be a result of other factors of experience: comfort, confidence, knowledge, etc, (or possibly a different confounding factor).
For the most part, trends disappeared. We show below the scatterplots of experience vs win shares and experience vs BPM for each of the four ratings groups. We also included the regression lines, but more notably than the line itself are the pathetically small r-squared values, indicating that within each group there is effectively no correlation between the two variables.

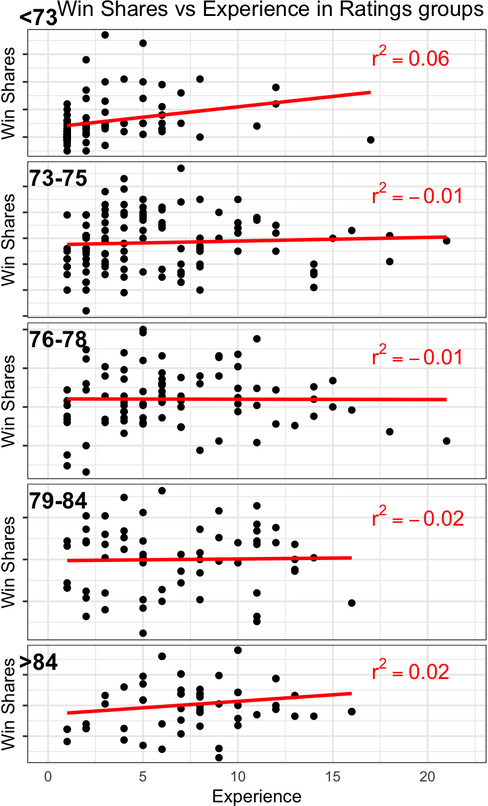


Recall, the associations we observed at the beginning should still be present after stratification. They are not. So, we conclude that the trends for individual performance metrics vs experience are actually just a result of the confounding factor. In other words, any association with experience is just pointing out the trivial relationship between player ability and the positive impact on their team.
Now, there are two groups that retained a meaningful correlation: WS for ratings < 73, and BPM for ratings >84. For the latter, ratings above 84 is a very wide range, so it is most likely that the correlation here is still a result of ratings differences. Stratification aims to fix the level of the confounding factor, but a range of 13 isn’t a very fixed level, leaving it likely that the confounding variable still has an effect. We will come back to the WS association for ratings <73 later.
We also analyzed team wins in this grouping. Even with the strong correlation in two groups, we still certainly conclude that the ratings are a factor- the data looks different after stratification. If ratings didn’t matter the correlation should be preserved across the board, which it clearly isn’t.

However, half the data preserving its correlation is odd. Why would veteran presence only matter if the veteran in question has a rating between 76-84? Maybe this is the reality, but it seems very likely that there is another confounding factor at work, one that particularly affects average players. Logically, there is a very obvious one: which teams get which players.
Lets elaborate, keeping in mind this particular group of players with ratings 76-84. Look at the bottom left corner of these groups’ scatter plots. We see inexperienced players with far below average team wins. These good young players are mostly being drafted to bad teams that hold higher draft picks. In general, a team doesn’t magically become good after drafting one good rookie. By the time these players are more experienced, they have either moved out of these ratings groups, left their bad team, or their team has gotten better. So, these players have low experience and are on teams that don’t win games, allowing us to see a trend without there necessarily being any true connection between the variables. Adding to this, although all NBA teams are given two draft picks every year, teams who are more focused on winning in the present, trade their picks and therefore have less incoming inexperienced players. So, all the players on these teams have higher experience and higher personal team win values, again creating a faulty correlation.
A great example of this situation is De’Aaron Fox, a player drafted in the top half of the lottery (#7 overall) in 2007, but he was drafted to the Sacramento Kings. The Kings -in recent memory- are notorious for being an abysmal organization. Part of being a bottom feeding organization like the Kings is not winning many basketball games. So, his rookie and sophomore year, De’Aaron Fox is exactly what we are talking about: a player with low experience and low team wins in the 76-84 ratings groups, through no real fault of their own.
The structure of the NBA draft and its effect on experience vs success shows up as well in the analysis of our own metrics: Average Experience on the Roster (AER) and Average Experience on the Floor (AEF). When we used linear models to gauge the relationship between AEF/ AER and win percentage, we noticed a large difference between the two metrics. As a predictor variable, AEF had a p-value of 0.00323, whereas with AER the p-value was 0.1630. Comparing these to the standard significance of 0.05, we can conclude that AEF is a much more significant predictor of the response variable (win percentage) than AER is. Very similar results occur when AEF / AER are measured as predictor variables with net rating as the response variable. In this case, AEF had a p-value of 0.00179, demonstrating its significance, and AER had a p-value of 0.1265, demonstrating its insignificance.

So what is creating such a large difference in the relevance of AER vs AEF? We point primarily to the NBA Draft. On good teams, the draft picks are generally not as talented and play less, which means less inexperienced players are on the floor, so the AEF for these good teams will be higher. In contrast, bad teams have a lower average experience on the floor because they have higher and often better or more promising young players that they prioritize playing and developing over winning. So, AEF makes sense to be highly correlated with winning. However, most teams have and draft these inexperienced players (every team initially has two draft picks per year), the difference is primarily whether they get heavy minutes.
In a quick aside, this discussion of minutes distribution also provides an explanation for the correlation between win shares and experience in our under 73 ratings group. Recall this was the only group and metric that had a high r-squared value that we haven’t yet discussed. We will revisit the plot for this group below (left).


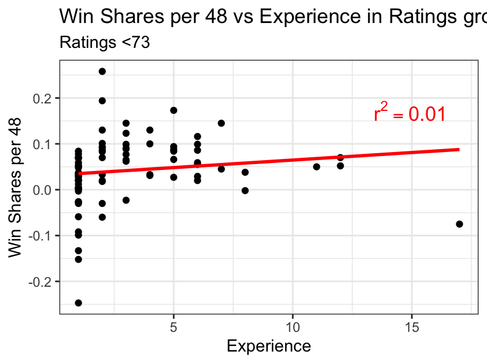
We see a cluster of rookies at the bottom left of this plot with very low win shares, effectively “pulling” the left side of this regression line down. Considering the NBA draft again, these are the less talented rookies that got drafted to good teams. These rookies on good teams don’t tend to play very much. As we already discussed, this creates a noticeable difference between our AER and AEF statistics. It also means these rookies have very low win shares; win shares is a statistic directly influenced by minutes played. To demonstrate this point we re-did this plot, but with win shares per 48 minutes (right). We see that WS.48 vs experience has no correlation, confirming our assumption that the trend in this group is only due to uneven minutes distribution. Which, again, is due primarily to the nature of the NBA Draft.
Now, returning to AEF and AER, we wanted to look at other explanations for their difference, beyond just the draft order. We considered shot location data; however, there were no significant associations between AEF and “two point attempt rate”, “three point attempt rate”, “midrange attempt rate” and “rim attempt rate.” We also considered these metrics for opposing teams, where the opponent “rim attempt rate” was nearly significant. The relationship held an R-squared value of 0.1275, and a p-value 0.0527 which is extremely close to being less than the significance level of 0.05. When hypothesizing the reasons for this trend, the answer came down to a defensive scheme. In the modern NBA, the vast majority of teams will try to concede the least efficient shots which are the midrange, however most defensive schemes are built off the principle of either most prioritizing taking away rim attempts or the three point line. Taking away the three point line takes far more energy and effort because to do this there is more ground to cover. For older NBA teams with lots of minutes and mileage on their bodies, it makes sense to take away the rim attempts as the primary defensive focus so the old players can minimize the stress on their bodies, move far less, and lower the risk of exhaustion or possibly injury.

However, as much as this significance makes sense, it does no good in explaining the possible difference between AER and AEF. No one defensive scheme is universally better than another, each team will just find the one that best fits their personnel. So older teams picking one defensive scheme just means that they chose that defensive scheme, a pretty trivial relation. Combining this with the lack of significance between AER/AEF and other variables, we feel confident in claiming that the differences between the two metrics are best explained by the nature of the NBA Draft as described earlier.
Conclusion
It is fair to conclude that veteran presence, at least in the short term of a single season, is a phenomenon that can be reduced to other factors. Most notably, the talent of the player has a strong, positive correlation with experience, but an equally talented player with less experience tends to have on average the same positive effect on the court. The consistent association between success metrics and experience becomes a jumbled mess after stratification of ratings, further demonstrating the importance of ability and player rating above player experience.
Additionally, teams with higher average experience tend to be more successful, but less successful teams tend to get better draft picks and include more younger players as they aim to be successful in the future. Does this mean the older players help their teams win more, or just that the better younger players are stuck on bad teams until they can play in an environment with more surrounding talent?
We do want to readdress the shortsightedness of our paper. We can make no claims that “veteran presence” is not real, or that veterans don’t measurably help the players around them, because we only considered a single year. Development of a player occurs through their career, so a full career with a guiding veteran may still be beneficial, just not one we measured or addressed. We only conclude that within a year, “veteran presence” is likely a mislabeling of other factors that contribute to success.
The Thunder’s successful bubble 2019-2020 season is commonly cited as the epitome of veteran presence. The team was full of young players, who, surrounded by a veteran star, performed far above expectations. They managed to rise to the #5 playoff seed in their one year with Chris Paul, before plummeting below mediocrity after trading him away to the Suns that summer. With our analysis, we raise that Chris Paul’s genius as a point guard is far more relevant to the Thunder’s success than his experience. Although his knowledge has certainly grown over his career, he is a generational talent, and has always been one of the best players ever at making his teammates around him better. To this end, a young point guard virtuoso, or even a third year version of Chris Paul, might’ve helped the Thunder be just as successful. For their 2018-2019 season, they just happened to have a veteran one.
Sources
Disclaimers
* Using ratings from 2K20 compared with statistics from the 2018-2019 season has some flaws. First, some players retired, and therefore were not included in 2K20. We manually added their ratings from 2K19, which should be mostly the same as what their ratings would have been in 2K20, had they not retired. Secondly rookies were coded into 2K20, who obviously did not play in 2018-2019; we did not include these players in analysis.
˚ Our calculation for experience does not address any shifts in and out of the league. A player who played overseas for a year would technically have that count as a year of experience in our metric. So, this metric really is “seasons since draft year”, not “experience in the NBA” as we desired.
^ Addressing trades presented an interesting issue in matching team data with individual players who played for multiple teams. For individual metrics associated with that player we took their total stats over the course of the season. For team metrics associated with individual players, we removed players who were traded from any consideration. To deduce how many wins a player who was traded had, we would have needed to count their team’s wins before they were traded and their new teams wins after, which was a problem we addressed with avoidance. This was the same method we used on AEF and AER, as we discussed in “metrics”.


Comments