Do Small Market Stars Get Snubbed?
- Bruin Sports Analytics

- Apr 16, 2022
- 4 min read
By: Kaizen Schanz and Yusei Fujikura
The All-Star Game is a way of representing the league’s best players in the flashiest way possible. In the MLB, the players put everything on the line, giving the fans a glimpse of what could be. In the NBA, a more casual, yet just as entertaining show unfolds as an array of high flying dunks, coma inducing crossovers, and unworldly three point shots are made. To determine who gets to show off their skillset, fans from all over the world get to speak their mind about who is truly the best of the best.

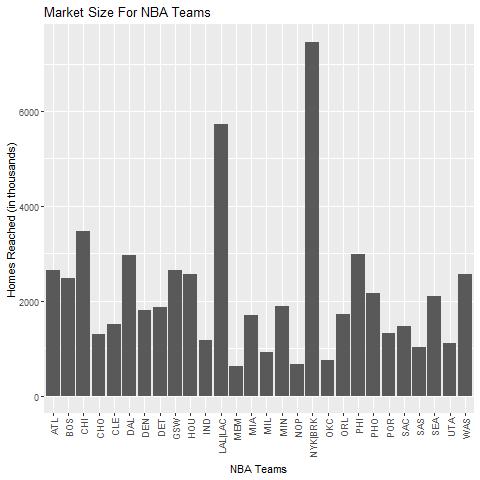

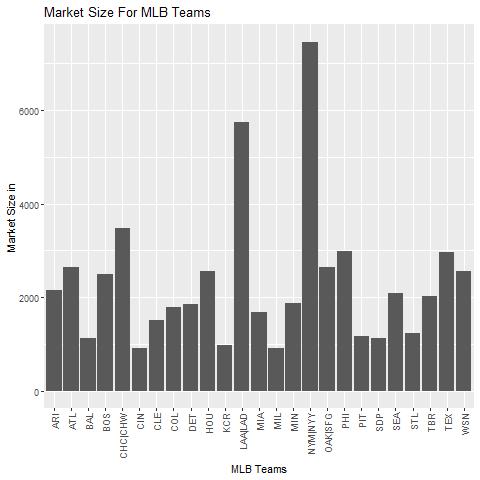

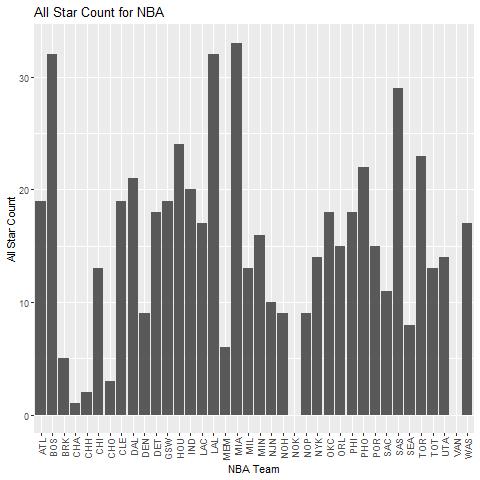

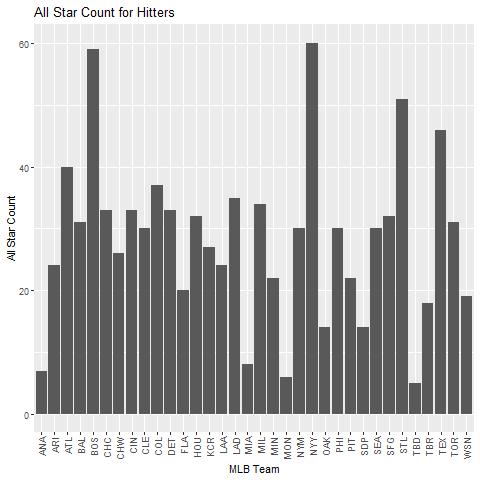

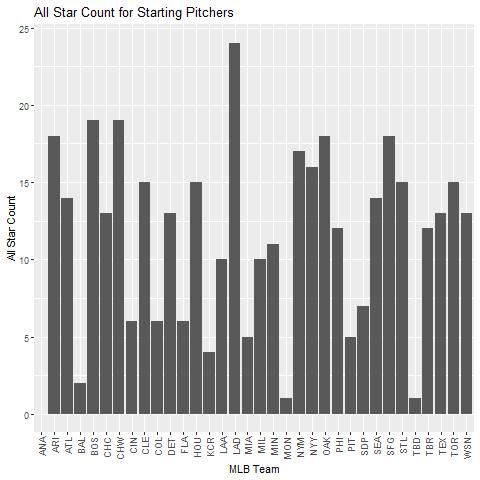

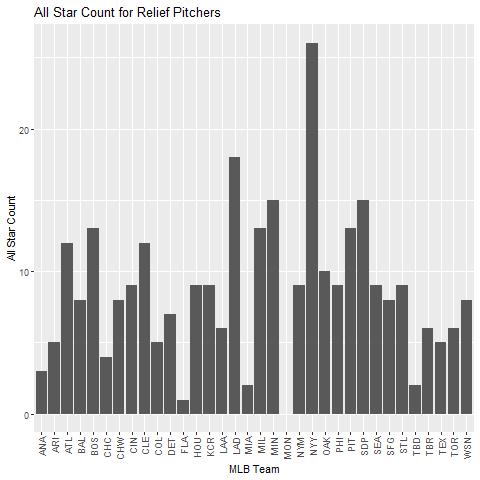
To start off our investigation, we took a look at the distribution of All-Star players amongst NBA and MLB organizations to see whether we could identify a pattern in regards to market size. Regions like New York and Los Angeles represent the largest markets, while teams from New Orleans and Memphis round out smaller fan bases. The 1974-75 season was the first opportunity fans got to vote for their favorite players to be selected on the All-Star teams. Fans had 100% of the control over who would start in the All-Star game during this time. In 2016-17, fans began accounting for only 50% of the vote to determine the starters, while players and media made up the other half of the vote. We assumed that because fan voting was a main factor in the All-Star selection process, we would see a trend with market size of NBA and MLB organizations compared to All-Star selection. From the initial graphs, we can’t directly see a correlation between these two categories. In the NBA, teams like the Celtics, Heat, and Spurs have the highest counts in terms of All-Star selections, but are areas that have mid to low market sizes. In the MLB, hitter All-Stars were dominated by the Yankees and the Red Sox, the starting pitchers saw many from the Dodgers and the Red Sox, and a plurality of selections was made from the Yankees and the Dodgers. The Yankees and Dodgers are teams from the biggest markets, but the Red Sox have a very average market.
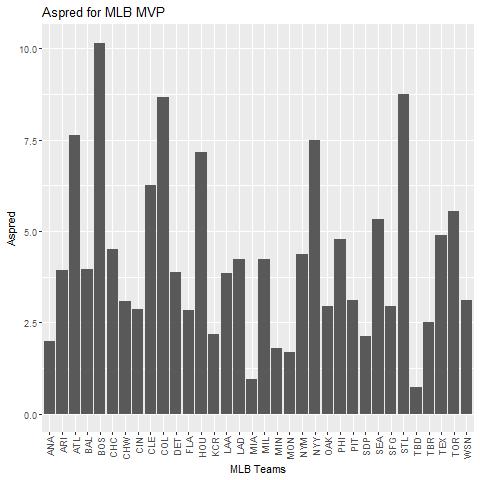
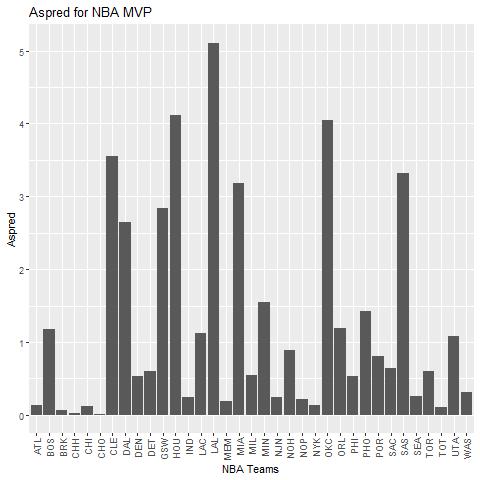
Snubs are used to reference when players are "robbed" of an All-Star position. We created models using the machine learning algorithm Neural Network with a variety of player statistics in order to predict the probability of being an All-Star or MVP any given year. The stats for the MLB model for hitters included batting average, on base percentage, slugging percentage, WAR, games played, and more, while the model for MLB pitchers included wins, innings pitched, ERA, FIP, and WAR, and more. The NBA model included many per game stats (e.g., points, rebounds, assists, steals, blocks) as well as more advanced stats like Win Shares, Offensive and Defensive Box Plus Minus. Then, we tallied up the total probabilities of all players who did not make the All-Star game or did not win MVP, grouped by team. The aggregate probability of players that got snubbed is represented by the graphs below.


For the NBA, it seems that the LA Clippers and the Utah Jazz saw a remarkably high Aspred (abbreviation for the aggregate probability of being snubbed). This is an interesting observation because the Clippers and the Jazz are on opposite sides of the market size spectrum. On the other hand, the MLB has a more even distribution of All-Star Spread, except for teams Anaheim Angels, Montreal Expos, Miami Marlins, Tampa Bay Devil Rays, which is a common thread throughout the hitters, starting pitchers and relief pitchers. However, these teams have since changed names or locations, which is why their stats are so low in comparison to the rest of the league. The NBA MVP and All-Star Spread seems to be much more sporadic, seeing highs in teams such as the Lakers, Oklahoma City, and Houston. These correlations can possibly be explained by the star players that dominated the teams over the last two decades. The Lakers were represented by Kobe Bryant, Shaq, and Lebron James, while OKC had Durant and Westbrook, and Houston had James Harden, Yao Ming, and Tracy Mcgrady. Other teams who have had a rough past two decades see close to 0 All-Star spread, meaning that every time they had a star, they won the MVP (Chicago with Derrick Rose) or they simply haven't had many franchise players. From the two graphs below, MVP Aspred seems to be much more volatile in the NBA compared to the MLB. This could possibly be explained by the fact that NBA MVP voting is weighted more heavily on team success when compared to the MLB. Because we see certain teams consistently dominate over the years, we can see why this discrepancy forms between the MLB and the NBA.

In conclusion, we weren't able to establish a cause-and-effect relationship between how often players get snubbed of an All-Star/MVP vote. However, we were able to gain insight on the different dynamics at play with the NBA and MLB. Because both the NBA and MLB only determine starters due to fan voting, it is difficult to draw a relationship between fan base and All-Star snub-ratio. Additionally, the two differ in how many players get to play on each team, which creates a discrepancy between the values of All-Star Spread when compared across leagues. In any given year, there are 28 players playing in the NBA All-Star game, compared to the 70 that play in the MLB game. To be able to draw comparisons between the NBA and the MLB, we simply need to scale the numbers from the NBA by two and a half. The beauty of data in sports is that we can attempt to solve a piece of the puzzle through careful analytics of almost every action a professional player takes, and this time we weren’t able to draw conclusions on the team a player is playing for having an impact on getting robbed of an All-Star/MVP selection.
Sources:


Comments