The Evolution of the Free Throw
- Bruin Sports Analytics

- Jan 7, 2020
- 7 min read
By: Ethan Allavarpu and Kyle Boal
The Free Throw: the only shot in basketball that is theoretically free, but players continue to show that it's more difficult than it originally appears. In the early 2000's, the idea of "hack-a-shaq" was introduced. This strategy had players intentionally foul poor free throw shooters, such as Shaquille O'Neal to send them to the charity line. The hope: at least one missed free throw, and an opportunity to seize possession once more. However, as this strategy became popular, teams sent their poor foul shooters to the bench at late moments in a game. Fast forward to 2015: Stephen Curry became the eighth player to join the 50/40/90 club (50% field goal, 40% three-point, 90% free throw), and many shooters began to score at an all-time high rate. With shooting success becoming fundamental to an increasingly offensive game, we thought it would be interesting to look at how the free throw differs from years, stars, position, and three-point shooting.
PROCEDURE
To evaluate and compare how the free throw differs from years, stars, position, and three-point shooting, we decided to look at the evolution of the free-throw percentage over two different three-year spans separated by nearly 20 years (2000-2003 and 2016-2019). The question: were players getting better at shooting percentages or was there simply a higher volume of shots and, importantly, how does that relate to the free throw? We compared each individual year of the three-year spans to one another, in order to get an idea of what year-to-year variation in shooting looked like. Next, we compared the two decades with one another to see how the game was truly changing.
Notably, however, Stephen Curry and Shaquille O'Neal are very different players and should not be compared directly with each other--and thus should be categorized as such. To accommodate for this, we created groups in accordance with the main player's position (e.g. center, point guard).
Additionally, we thought it would be worthwhile to delineate between the Matthew Dellavedova's of the world and the Lebron James' of the world--those that are high scoring versus those that are not. To do so, we looked at the variation between "stars" (defined as top 20 in points or top 10 in rebounds or top 10 in assists) versus the variation in non-"stars" (people who are not in any of the above categories).
During garbage time, the trailing team can sometimes rack up an unusually high tally of statistics, leading the respective box score to be misleading with respect to their actual game performance. To limit the players we are analyzing, we added the following caveats to exclude garbage time players: a player must play at least 20 games, average at least 10 minutes per game, have a minimum of one free throw attempt per game, and strictly shoot more than 0.5 three point attempts per game.
OUR PREDICTIONS
Initially, especially because of the "hack-a-shaq" era of the early 2000s, we anticipated a large discrepancy in the free throw percentage by position; we expected guards to have the highest percentage (~85%), followed by forward (~75%), and lastly centers (~65%). Furthermore, it seemed reasonable to conclude that if players shoot the three-point shot at a higher rate and percentage, then hopefully, those same players would spend equal time practicing the one shot they should be guaranteed to make every time: the free throw.
Additionally, we believe that non-stars will have less variation in free throw percentage, as stars don't need to focus on the free throw, given their tremendous impact to other facets of the game. Non-stars, however, have less room for error--and should practice, seize, and execute at an opportunity of free points.
DATA
Before crunching numbers, we noticed an interesting trend in the amount of players who qualified for our study over the years. For example, whereas the average number of centers who met our shooting qualification (as defined above) in the 2000's was 5.67, the average number of centers for the 2010's was 29.67. Likely, this can be attributed to centers shooting the three point shot more often as time went on, and thus, more qualified under the "3PTA > 0.5" requirement.

The variation in the year-to-year data within the early 2000s--the first of two time periods in this article--remained relatively low, with the greatest variation across the three years occurring at the forward position, but it was still within 1% (76.88% to 77.72%). The data from the early 2000s also emphasizes the general trend which we expected, specifically, that centers had the lowest free throw percent (hovering around 74%), followed by forwards (~77%), and guards with the highest (~79.5%). Although the data did not have the percentages which we expected at the outset of the investigation, there was still a delineation between each position. Further, since the variability between these individual years remained low, any difference between these years and the decades could be attributed to a difference across basketball eras as opposed to the accumulation of annual differences; each position had a dip in free throw percentage either in the 2001-2002 season or the 2002-2003 season.

At the tail end of the 2010s--the second of two time frames studied in this article--the data appears murkier when comparing the positions. In terms of variation by year, each position still remained relatively steady with the largest range of ~3% occurring at the guard position (81.11% vs. 78.08%). Although the variation did increase--as shown through the higher standard deviations--the data remained constant enough to compare this time frame to that of the early 2000s to look for the desired change in free throw percentage, at least by position. The aspect of this table which surprised us was the free throw percentage of centers compared to forwards, as they were approximately equal, with centers having a slight edge, not forwards; the guards had a higher percentage than the other two groups but by less than earlier in the NBA's history.
2000's v. 2010's:
To concatenate the data for the two basic time periods: 2000s and 2010s, we took an average of the three year periods we originally studied, for each decade period. This combined data is shown below:

This data highlights the surprising lack of difference within each of the three positions from the early 2000s time frame to the late 2010s. In the 2000s, at least, the data appeared exactly how we expected: centers, then forwards, then guards, albeit at a lesser degree than what we anticipated; there was only a 2% difference when grouping by position as opposed to our expected 10% difference. However, in the 2010s, the data paint a distinctly different story, as the centers increased their free throw percentage, while guards and forwards actually had a decrease in their free throw percentages as a position group, making their free throw percentages all occur within a 3% range. Furthermore, the players during the 2010 era exhibited greater variation, as their standard deviations increased by about 1.5 percentage points: thus, players in today's NBA occur across a broader range of the spectrum, as there are some elite free throw shooters (e.g. Steph Curry, James Harden), but also some horrendous ones (e.g. Lonzo Ball).
STARS v. NONSTARS

The data shows that the stars in the NBA have a higher free throw percentage by a margin of almost 2% in both decades. Likewise, in both decades, the standard deviation for stars is less by a notable margin of at least 0.5%. Unexpectedly, both the free throw percentage of stars and nonstars went down by a factor of at least 0.5% from the 2000s to the 2010s. Moreover, shooters in the 2000's were much more consistent, as demonstrated by an increase of 1% in standard deviations from the players in the 2000s to 2010's.
THREE POINT CORRELATION
It was our hypothesis that there would be a correlation between three point percentages and free throw percentages. To show this correlation, we created graphs conveying each player as a dot, placed according to his free throw and three-point percentage. Additionally, we have created a line of best fit, showing the general trend for each decade in question.

The 2000's exemplify consistency. The line of best fit shoots a free throw possession from around 73% to up to around 82%. Additionally, there is a large clump of players all in the same spot. With few outliers, the data leads to the conclusion that the 2000's was very consistent.

The 2010's are much more turbulent. This can likely be attributed to higher shooting volume. Here, the line of best fit for free throw percentage spans from as low as 60% to as high as 87%. This is a much different range than in the 2000's where the deviation is 9 points as opposed to the 2010's where the deviation is 27 points. Additionally, there are more outliers than the 2000's, as well as a generally larger clump.
We overlaid the graphs, as shown below, to get a visual of what the two decades looked like:
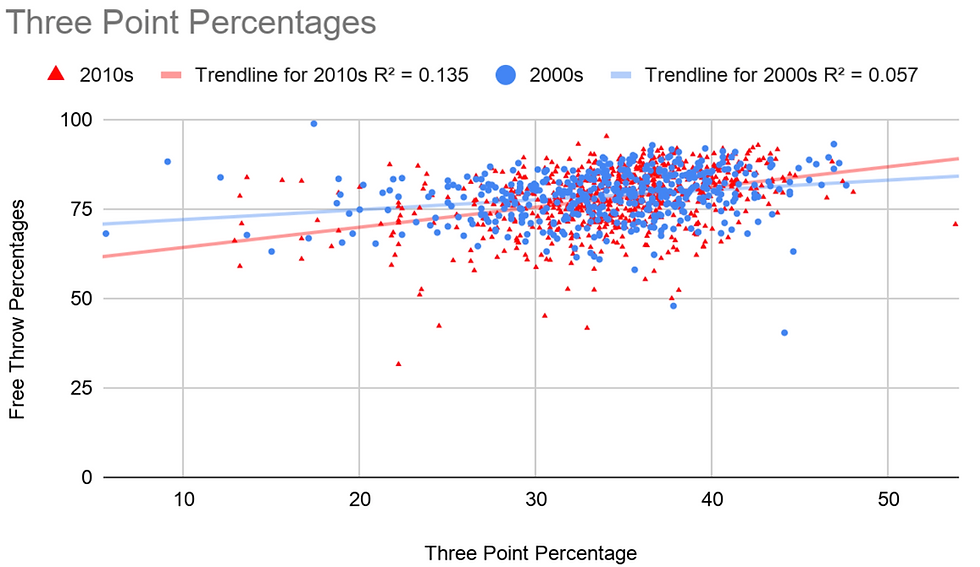
The 2000's seem more consistent, as the line of best fit seems to go from around 74% to up to 85%. However, as shooting as increased over the decades, the 2010's graph shows a different story. Not only are there more points in the 2010's--due to higher shooting volume--there is also more inconsistency. At the top end, in the 2010's, shooters have higher three-point-to-free-throw percentage ratio, such as Lonzo Ball. While the visual is an eye sore, it shows the correlation and development over the years; the game has progressed such that there is a higher volume of shooters, but with the increase in volume there is a much higher variance in percentages.
CONCLUSION
Ultimately, our data paint a picture that is in stark contrast to our initial expectations. No single position has completely distanced itself from the other two in terms of free throw percentage; in fact, in today's game there is less of a difference in free throw percentage amongst different positions than there was in the 2000s. More variability in our data also emphasizes that, although we have better players at the line today, we also have worse ones. The average for guards and forwards decreased between the two time frames, while centers had an increase. These results lead us to question the "hack-a-Shaq" method which has become so renowned -- the fouling of big men in crunch time. Perhaps centers have responded to that method of "bullying" by bolstering their free throw percentage, especially when compared with players at other positions. Maybe the adage should simply be revised, as free throw percentage is not as position-dependent as it seems on TV. Maybe the adage for today's NBA should not be "hack-a-Shaq."
Maybe it should be "hack-a-Lonzo."
Sources: NBA (NBA.com), ESPN (espn.com)


Comments