Do Bigger Pockets Lead to Greater Success?
- Bruin Sports Analytics

- Dec 23, 2025
- 8 min read
An Investigation Into NCAA MBB NIL Spending
By: Shayne Gangle, Danny Lenney, Eddie Mendel
Introduction: A Changing Landscape
College basketball is in the midst of a transformation. The NCAA’s introduction of the transfer portal in 2018 gave players more control over their careers, making it easier to move from team to team with little consequence. Then, in 2021, the introduction of Name, Image, and Likeness (NIL) rights granted players the ability to earn money legally, further changing the recruiting landscape. These two shifts have made it easier than ever for big-name programs to attract talent, with budget often being a deciding factor.
With these growing pressures, public universities have been steadily increasing their investment in men’s basketball. Athletic departments and boosters are funneling more resources into coaching, facilities, travel, and recruitment. As changes continue to impact the landscape of college sports, the future is largely unknown. This leads viewers to ask: Does a bigger bank account lead to better performance on the court?
In this article, we analyze the relationship between athletic department spending and team success across 110 public NCAA Division I programs from 2017 to 2024. We examine whether larger budgets have become more predictive of winning during the NIL and transfer portal era, and whether financial resources are now the key to advancing in the college basketball ranks.
Overview of Spending in NCAA MBB
Before tracking team success, it’s important to understand how spending has changed. Between 2017 and 2024, average spending on men’s basketball by public universities has grown year over year. With the only decrease seen in the 2020 to 2021 season, likely due to COVID-19. Since then, budgets have rebounded sharply. Figure 1 displays this steady increase, with the average spending across the league reaching $9 million by the 2023-2024 season.

Figure 1: Average NCAA Men’s Basketball Spending by Year
To understand the speed of this growth, year-over-year percent changes were tracked. As shown in Figure 2, there was a noticeable decline in spending during the pandemic, which quickly rebounded to higher costs. The rebound suggests a renewed push by universities and boosters to compete in the evolving college basketball environment.
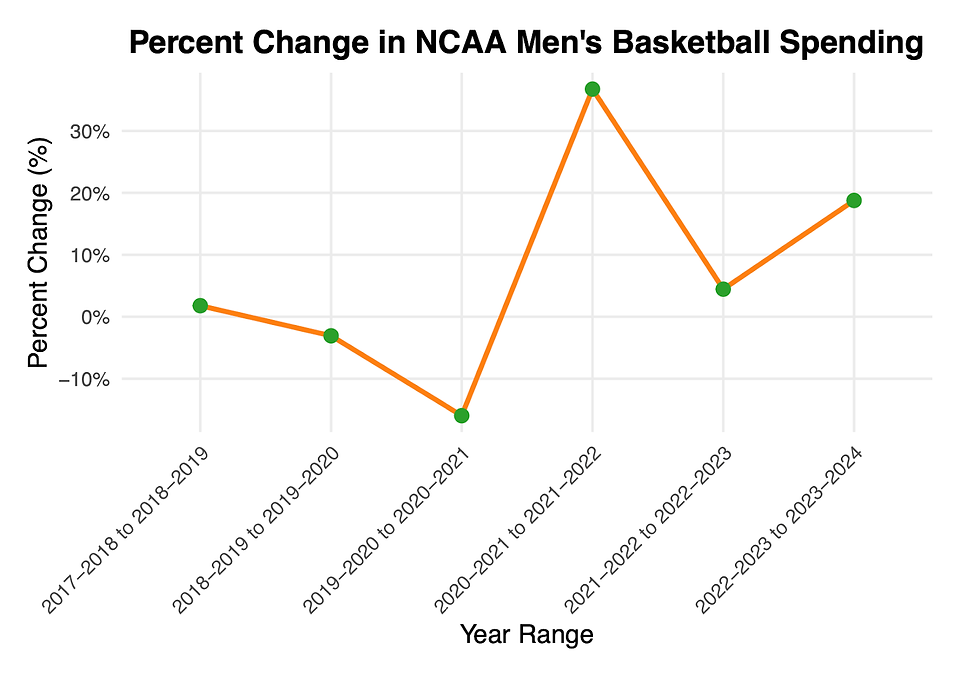
Figure 2: Year-over-Year Percent Change in Average Spending
The timing of these trends aligns closely with the rise of NIL and the normalization of the transfer portal. As players increasingly move toward programs that offer more exposure, better resources, or improved deals, the importance of financial power may be more significant than ever. The goal of this article is to see whether schools that spend more are winning more, and whether that connection has become stronger in recent years.
Exploring The Effects of Increased Spending
To explore the connection between spending and success, multiple metrics were tracked. These include the correlation between win percentage and average spending (Figure 3), Simple Rating System ratings and average spending (Figure 4), as well as an analysis of the top 10 and bottom 10 spenders in NCAA basketball since 2017 (Figures 5 and 6).

Figure 3: Average Win Percentage on Average Spending in Dollars Over the Last 7 Seasons
This graph presents a moderate positive correlation between Average Spending and Win Percentage, with a poor R-value of 0.388. Increased win percentage is not a direct effect of higher spending, which is likely due to various extraneous factors, including coaching, injuries, and some luck.

Figure 4: Average SRS Rating on Average Spending in Dollars Over Last 7 Seasons
Above, a strong positive correlation is detailed between higher spending and a higher rating on the Simple Rating System, a metric that accounts for average point differential and strength of schedule. The r-value is 0.816, and the p-value is well below 0.05, displaying that teams who spend more tend to play better against tougher competition. This relationship likely has a strong positive correlation due to the reality that teams who spend less tend to see worse matchups; however, it also shows us a clear relationship between bigger spenders and more competitive play.

Figure 5: Average Win Percentage of 10 Highest Paying Programs Over Last 7 Seasons
Here, it can be seen that eight out of the ten highest paying programs in college basketball have had an average win percentage of over .500 in a seven-season span. 6/10 teams had a record over 600. Kansas, the 5th highest paying program in NCAA Basketball, has seen an average win percentage of nearly .800 over the past seven seasons.
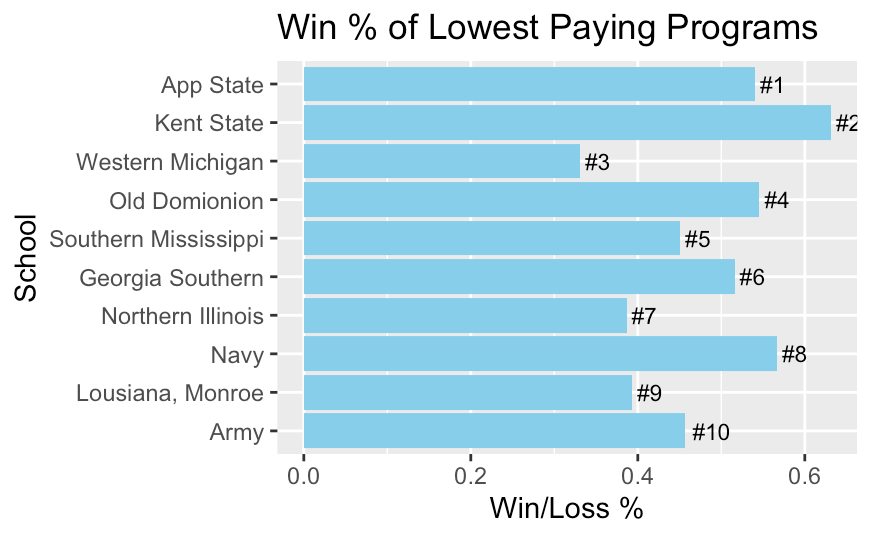
Figure 6: Average Win Percentage of 10 Lowest Paying Programs Over Last 7 Seasons
On the other hand, the ten lowest spenders have seen far more struggles on the winning front – Western Michigan’s average record is a measly .300, and five of the ten teams have a win percentage below .500 over the past 7 seasons, and 3 more have a win percentage below .400. Only one team, Kent State, had an average win percentage over .600.
Comparing Pre-NIL and Post-NIL Spending
Another important aspect researched on the effects of spending on winning was found by splitting spending amounts between the period from 2017-2020, before NIL existed, and 2021-2024, after the inception of the money-making program for athletes. Additionally, the percent change in average spending between the two periods was researched.

Figure 7: Win% of Top 10 Spending Increasers Since NIL Began (2021)
The bar chart above presents one of the most valuable pieces of data on the effects of NIL spending and stronger programs. It has become apparent that UConn’s back-to-back National Championships were no fluke, but an obvious result of consistently strong spending, and a big adjustment to the changing tides of NIL, as they made the largest increase in spending after the dawn of NIL. Beyond UConn, significant changes in winning are apparent for several other teams, including: Kansas State who saw a spectacular Elite 8 run in 2023, Missouri who has appeared in 3 of the past 6 NCAA tournaments after only making 1 in the 6 seasons before 2020, a Rutgers team that has ended their season in the AP top 25 in 4 out of the last six seasons since 2020 (after not ending a season ranked in over 40 seasons), and Florida Atlantic who made their first Final Four in school history in 2023. Adjusting to the times has proven to be effective.
Predicting Private Schools’ Spending
While the data used for this article focuses on public universities due to their required financial disclosures, many of the NCAA's most iconic basketball programs are private institutions that do not report spending figures. This presents a challenge when trying to understand the full financial landscape of college basketball. However, by building a model that estimates spending based on on-court performance, educated predictions about what private schools might be spending and how they compare to their public counterparts can be made.
For modeling public school spending, linear regression was used as a function of two performance-based variables: win percentage and Simple Rating System (SRS). These metrics capture both consistency and quality of performance across a season. Once the model was trained on public school data, it could be applied to private schools using their historical win percentage and SRS values from 2017 through 2024.
The model produced an R-squared value of 0.585, which means about 58.5 percent of the differences in spending can be explained by how successful the teams were. In simple terms, this means that more than half of the changes in spending between schools follow the expected pattern, based on wins and schedule strength.
Residuals, which are the differences between what the model predicted and what the schools spent, were also put to use. A positive residual means a school spent more than expected based on its performance. A negative residual means a school spent less. The typical size of these errors was about $3.1 million, which is called the residual standard error, and it tells us, on average, how accurate or inaccurate the guesses were.
To dig deeper, the 20 schools with the biggest gaps between actual and predicted spending were analyzed:

Some schools, like Kentucky and Louisville, spent nearly 10 million dollars more than what their on-court performance would suggest. That could point to inefficient spending or poor return on investment. Others, like Boise State, spent significantly less than predicted while still performing well, showing signs of strong efficiency.
These insights produce more than just rankings; they help show whether schools are making the most of their budgets. With the model showing consistent patterns across over 700 observations, it felt reasonable to apply it to making specific predictions.
Three prominent private basketball programs were selected: Duke, Gonzaga, and Villanova. Using their win percentage and SRS data from each season, regression and residuals can be applied to predict their spending. To show the uncertainty of each estimate, a 95 percent confidence interval is used based on the variability observed in public data.
Duke

Duke’s predicted spending remains relatively steady over time, hovering between 10.5 million and 11.5 million dollars. There is no apparent dip between 2020 and 2021, though, which reflects the fact that the model relies only on performance data and not real revenue shocks. Compared to public programs, Duke’s estimates are similar to schools such as Virginia, Michigan State, and Indiana. These are high-performing teams with consistent on-court results.
Gonzaga

Gonzaga stands out with the highest and most consistent predicted spending among the three private schools. Each year, they are estimated to spend between $11.5 million and $12.5 million. These values match their dominant performance metrics. Gonzaga’s predicted spending level is comparable to large public programs like Alabama or UCLA, even though Gonzaga competes outside of a power conference.
Villanova

Villanova shows the most variation in predicted spending, ranging from just under $10 million to nearly $11.5 million. These changes appear to track dips and rises in their regular-season performance. Their spending levels resemble programs such as Arkansas or Arizona, which also show variability in success across seasons.
Now let's compare the 3 schools:

When viewed together, the three private programs follow distinct spending trajectories. Gonzaga is estimated to spend the most and does so consistently. Duke shows a flatter trend with smaller increases over time. Villanova is more variable, with predicted spending rising and falling from year to year. These patterns generally align with each program’s on-court performance, but they also help reveal some of the model’s blind spots, including the hiccup in the 2020-2021.
Another blind spot observed is that most public schools displayed a general trend of increased spending year after year. The predicted values for private schools, however, do not follow this same steady rise, as the model is based almost entirely off of output on the court, and not as much input into the athletes, facilities, and coaching.
While these predictions are not exact spending reports, they offer a reasonable way to approximate private school budgets using consistent public benchmarks. Comparing these estimates to known public figures helps place elite private programs like Duke, Gonzaga, and Villanova within the broader financial landscape of college basketball.
Conclusion
Winning comes with a price. It may not always be the biggest spenders who win, although it tends to be. As NIL continues to grow at an unfathomable rate, constantly changing NCAA athletics as we know it, teams must adjust to the times. All NCAA sports are becoming sink or swim, with the big spenders getting more and more resources, taking them from the smaller programs. After a men’s basketball season like this past March Madness, with a completely star-studded, 1-seeded Final Four, viewers are left to wonder, will we ever get the 2023 Final Four back?


Comments