Win Share Distributions on Championship-Winning NBA Teams
- Bruin Sports Analytics

- Apr 2, 2022
- 8 min read
By: Matthew Sasaki and Aaron Phung
Introduction
It is difficult to predict the NBA champion each year. Take it from Stephen A. Smith, who incorrectly guessed the NBA champion 6 years in a row from 2011 to 2016. His guesses were also right before the NBA Finals began. We can’t blame him, though. There are simply too many variables to keep track of. Injuries, team chemistry, matchups, star power. The results of the playoffs can even boil down to a single play. There is no denying that luck plays a big role in determining which team wins the ring.
However, this does not mean that there is no way to gauge which teams have the best shot of winning the championship. There are many ways to approach this. Looking at the team with the best record definitely seems like a safe way to go about predicting the champion. However, it actually occurs less often than you would think. In the past thirty years, the team with the best record only won the championship in ten of those years. This could possibly be due to a different environment during the playoffs compared to the regular season. It is also possible to choose the team with the best player(s), but this is not a great method either. After all, many of the all-time greats have only won about 4-5 championships despite playing in the league for over a decade. In addition, it is very easy for critical players on a team to either have an off-night or suffer an injury. While both of these methods can provide some useful insight, they are not reliable and are subject to many other factors. We decided to look at a variable that is less susceptible to change and considers the championship team as a whole.
In this article, we aim to analyze the win shares distribution (WSD) of championship-winning teams. Win shares is the estimated number of wins a player produces for his team. The higher the win shares, the more a player is contributing to his team’s victories. By looking at the distribution of win shares of a team, we believe we will get a good indication of the team’s balance. For example, if every player on a team has the same win shares, this means that the team is very well-rounded, as the bench players contribute as much to the team’s wins as the starters do. On the other hand, if most players on the team have very low win shares, but one player has an extremely high win share, this means that most of the workload is placed on that one player’s shoulders, while the rest of the team is not doing much to help the team win.
We collected all of our data from Basketball Reference. In this article, we will first compare the WSD of the team with the best record from each season from 1990 to 2021 to the WSD of the team with the worst record from the same seasons. This information will allow us to see how teams that are in contention for a championship differ from unsuccessful teams. Next, we will compare the WSD of the teams with the best record and the WSD of the championship winning teams both in the regular season and playoffs. These steps will help us determine what it really takes for an NBA team to win the championship.
NBA Champs vs Last Place Team


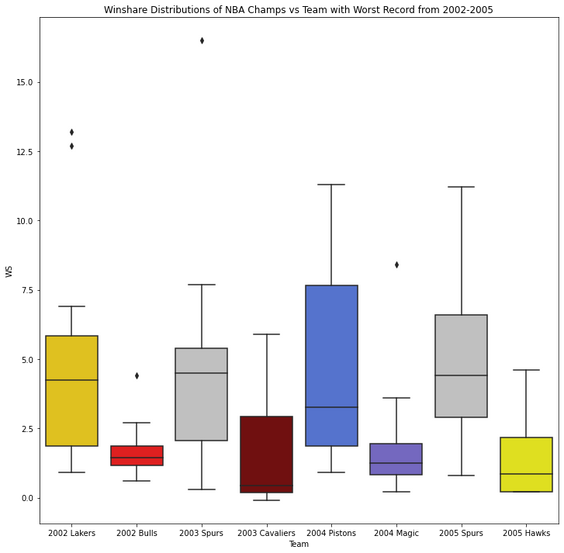


Above we have three different 4 year periods from each of the last 3 decades. For each group of two, the left side is the regular season winshare distribution of the NBA Championship winning teams, and on the right is that of the team with the worst regular record in the NBA. Each distribution takes the team’s top 12 winshare contributors. Looking at these distributions, it's clear that win shares are, at the very least, able to do a decent job at predicting a team’s number of wins. The boxplots for the championship winning teams were generally higher and more widespread. On the other hand, the teams with the worst records generally had lower box plots that were often more narrow. This makes sense, as teams with worse records should have fewer total win shares. We often see outliers for both championship winning teams and last place teams. However, the outliers on the championship winning teams are superstars, while those on last place teams are often just solid players.
NBA Champs vs Regular Season Champs
The differences between the best and worst teams are obvious to see. However, differentiating the WSD between the best record team and the champion was much harder. This goes to show how competitive the NBA season is each year. The difference between top teams is miniscule, but we were still able to find some patterns.

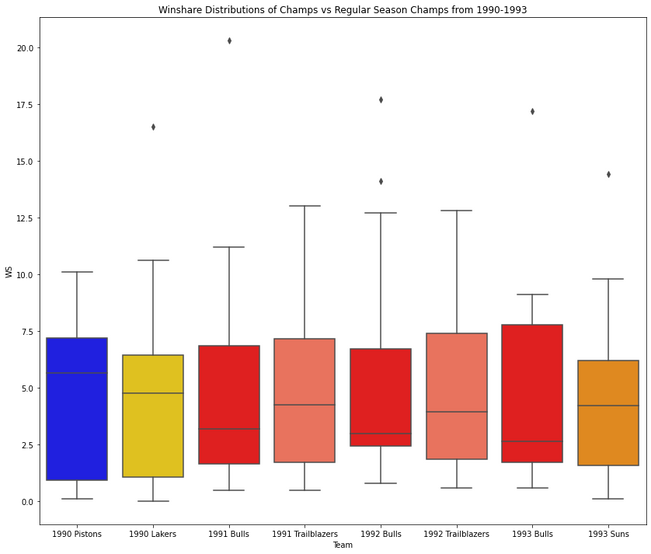


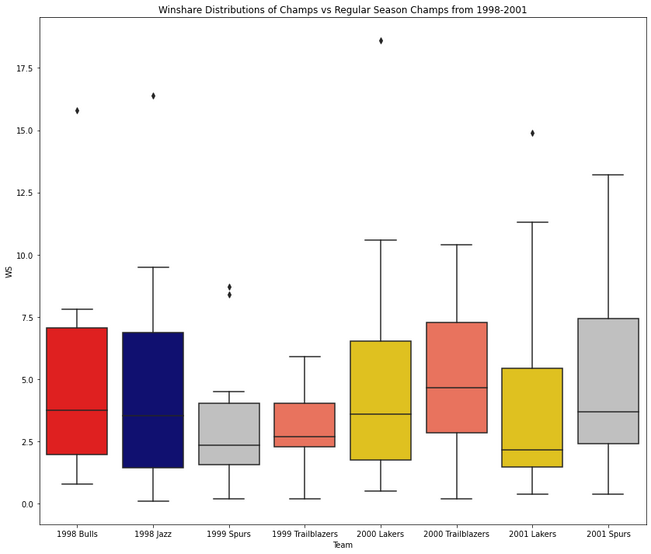


We will first compare data from the regular seasons. From 1990-2003, the champion had the player with the highest win share in 11 of the 14 years. In addition, the median win share of the champion was lower than the median win share of the highest record team in 9 of the 14 years. From 2004-2010, the median win share in the championship team was higher than the median win share of the best record team in all 7 years, but the best record team had a higher maximum win share in all 7 years. Lastly, from 2011-2021, the data was similar to the data from 1990-2003 in that the median win shares was smaller for the champions compared to the best-record team in most of the years. Unlike previous years, though, the WSD of championship winning teams differed from the best-record teams in very random ways.

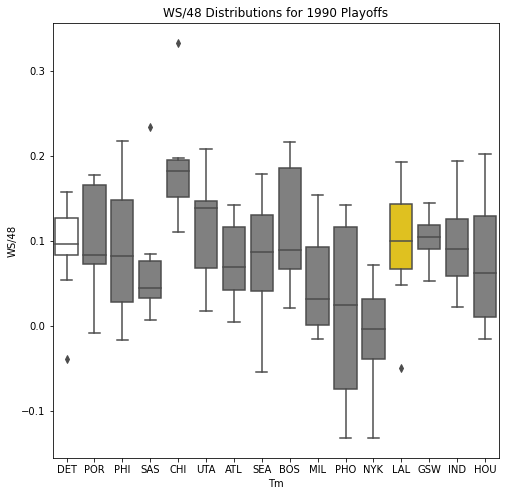

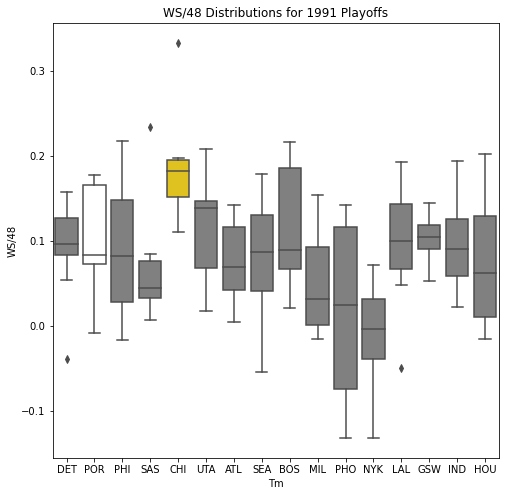

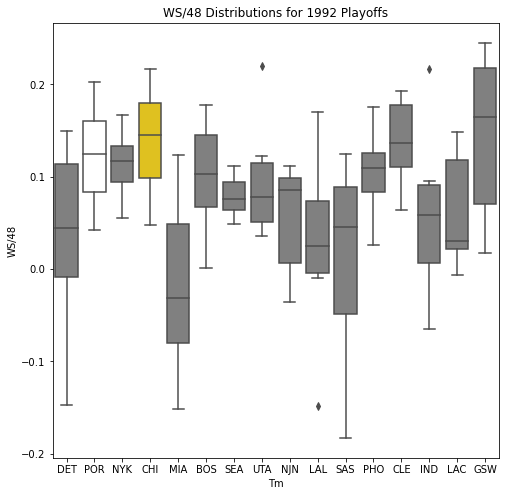

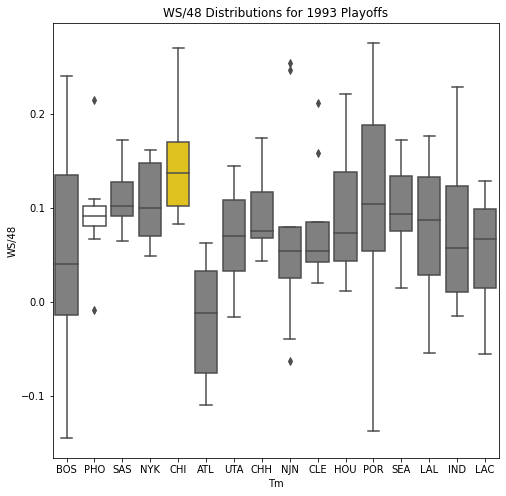

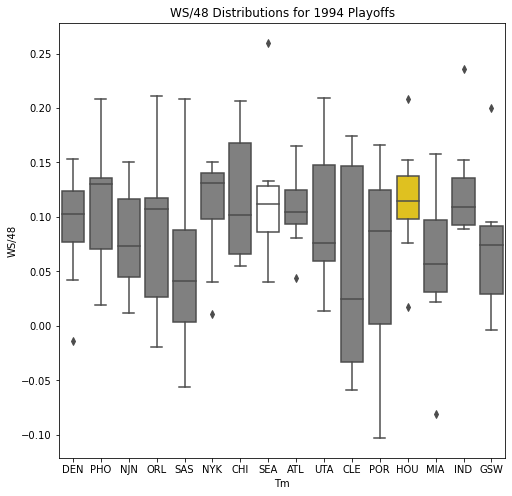

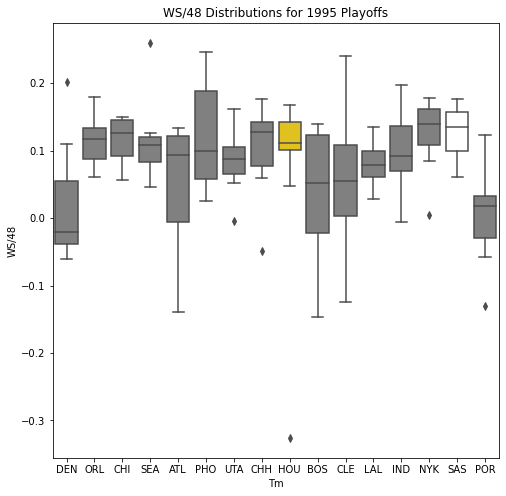

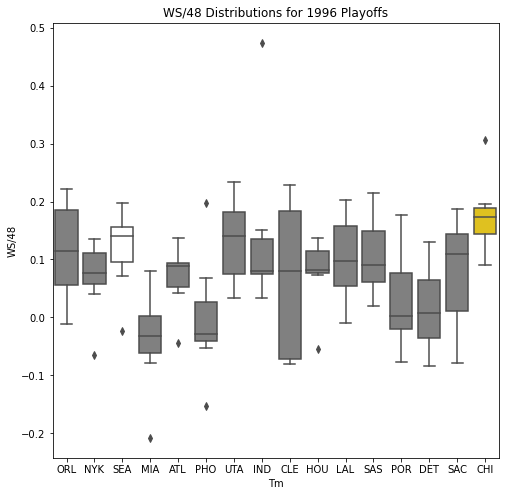

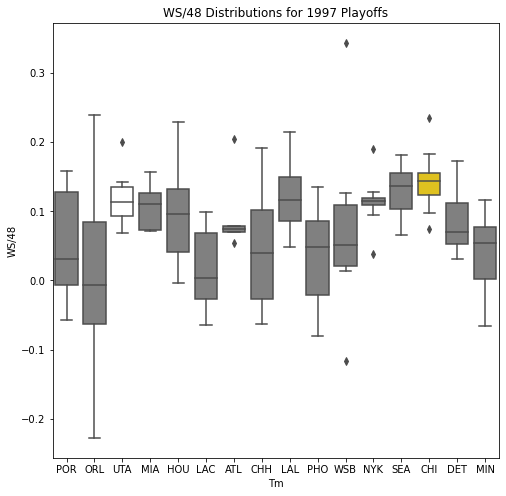

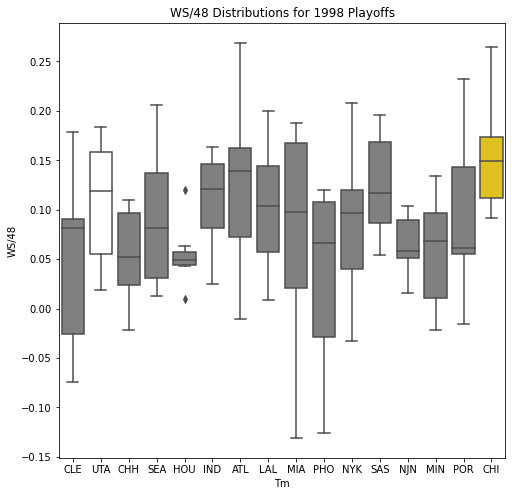

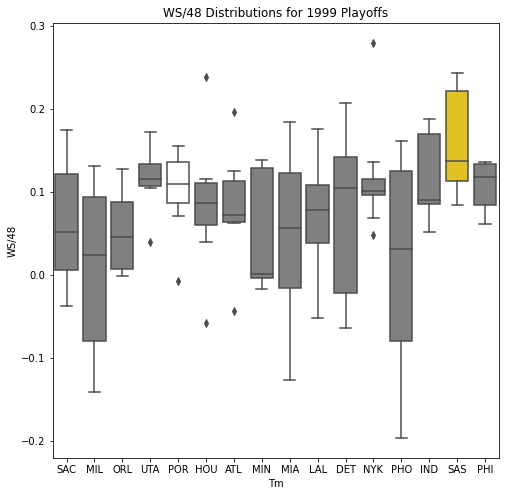

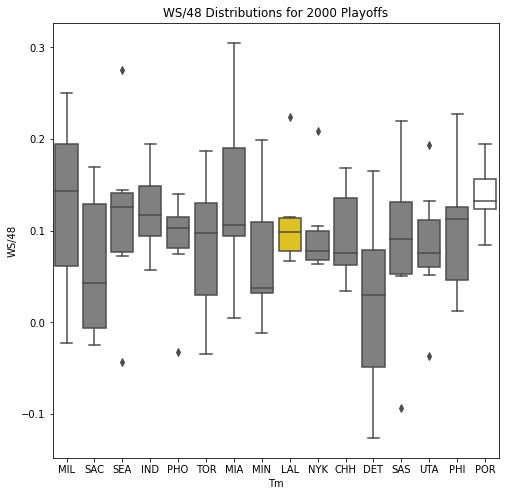

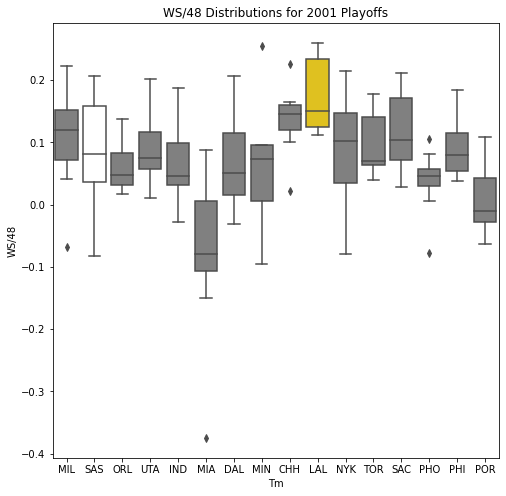

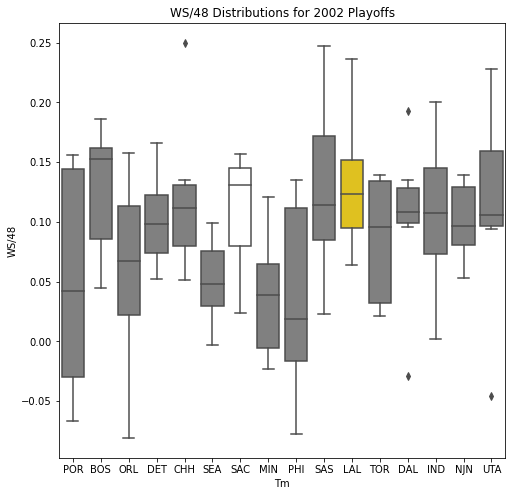

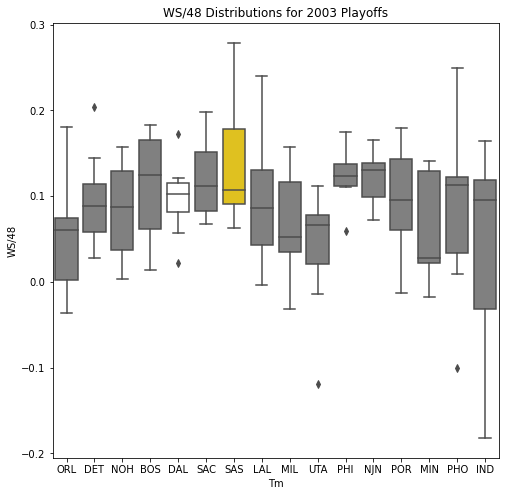

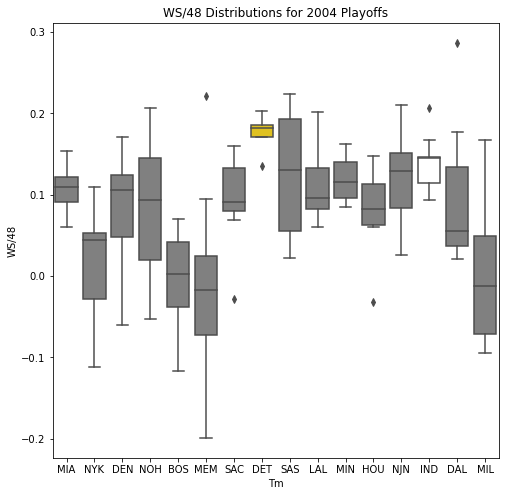

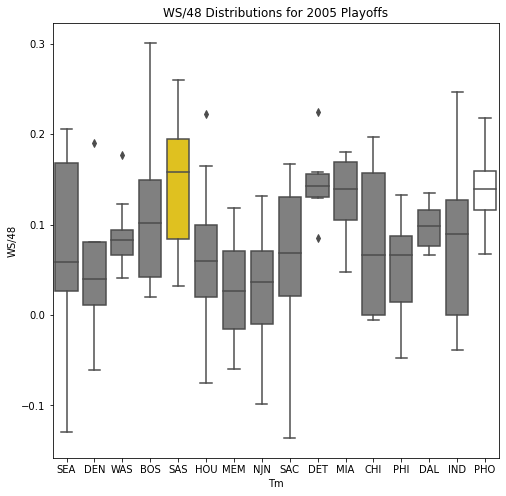

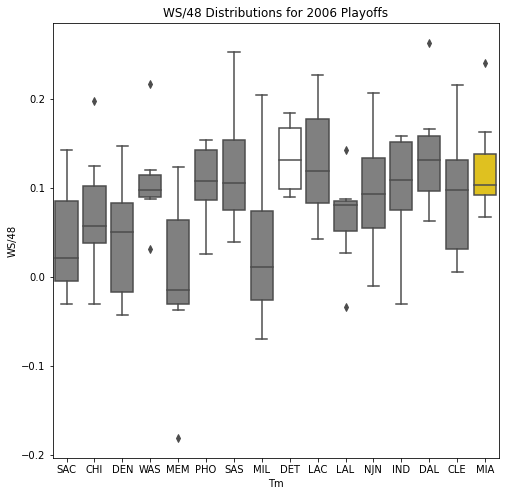

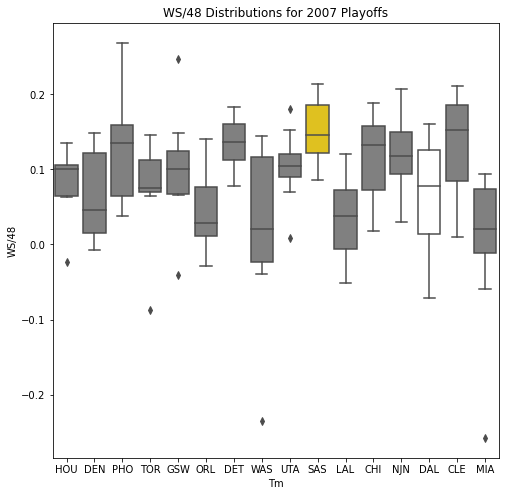

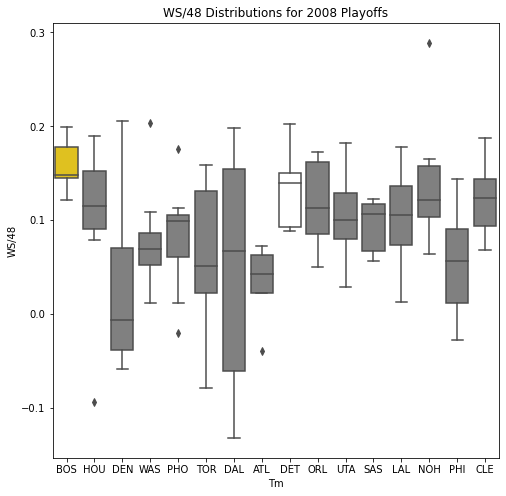

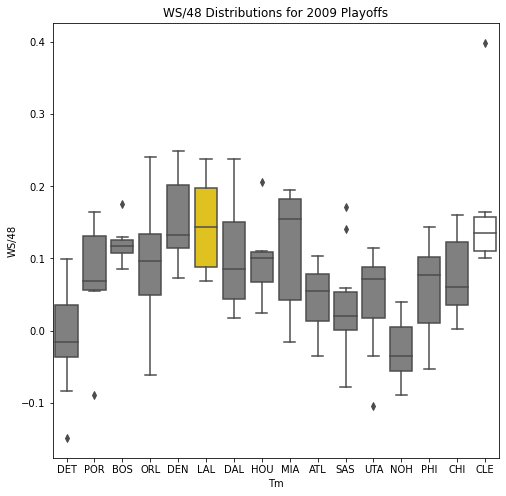

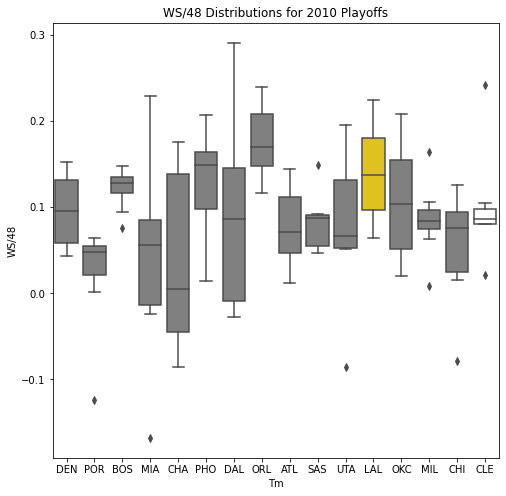

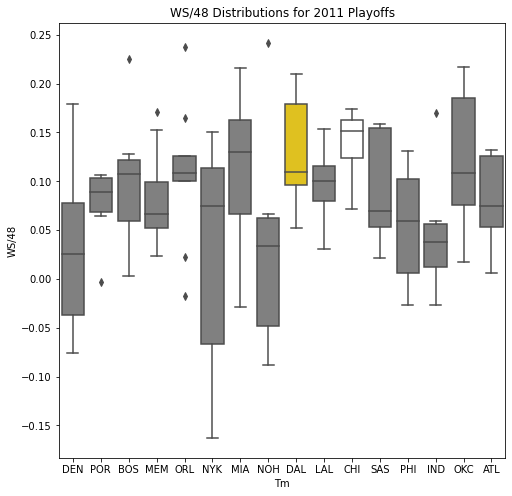

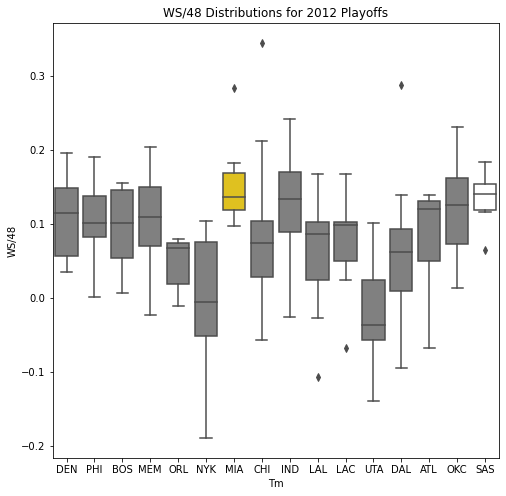

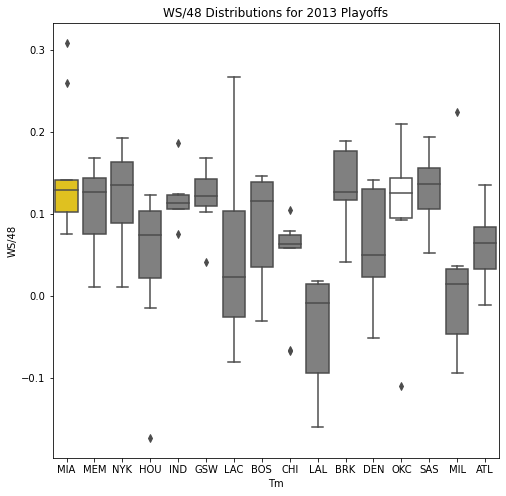

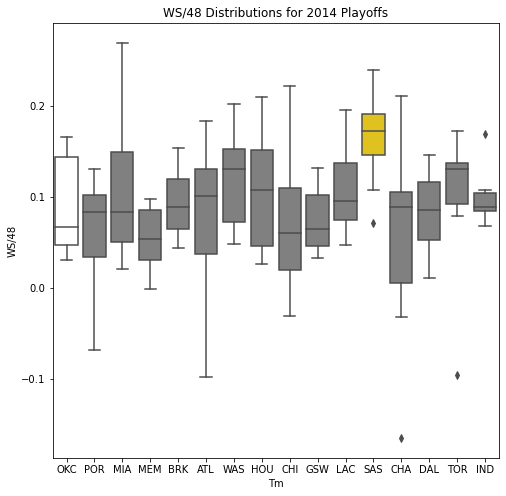

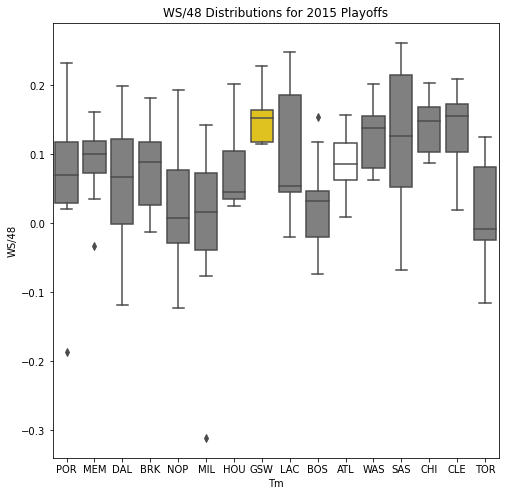

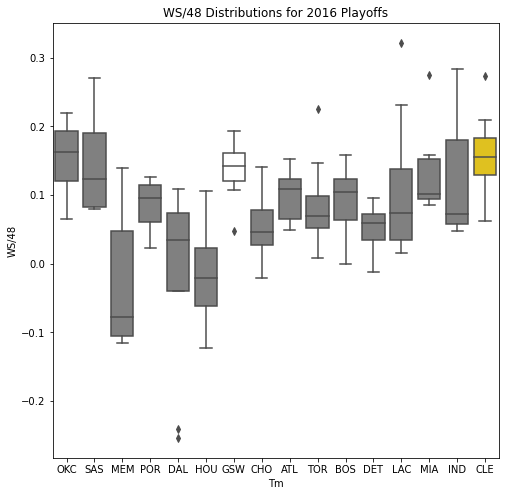

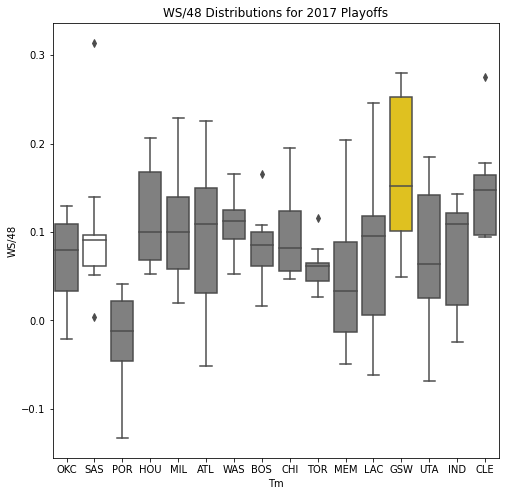

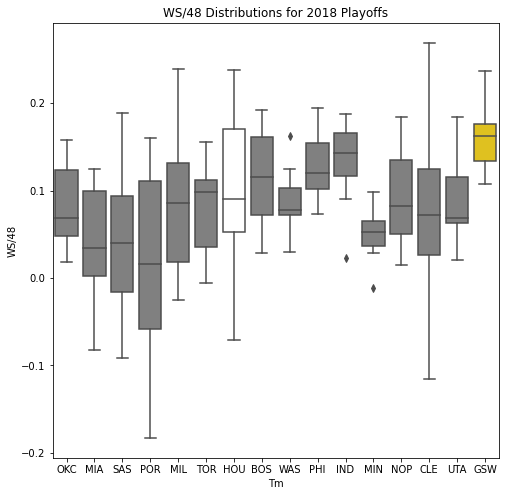

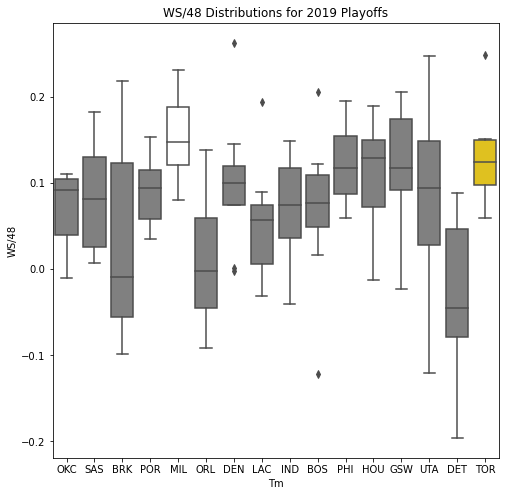

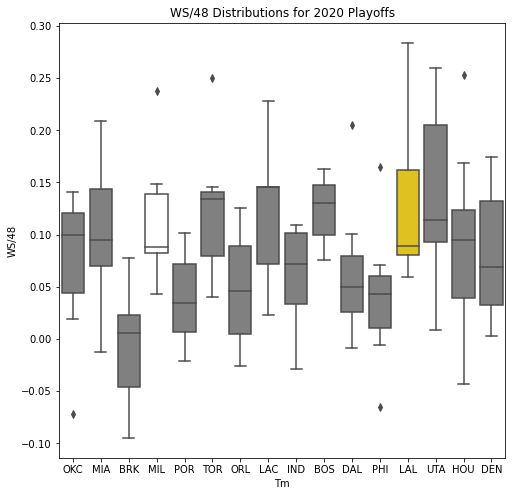

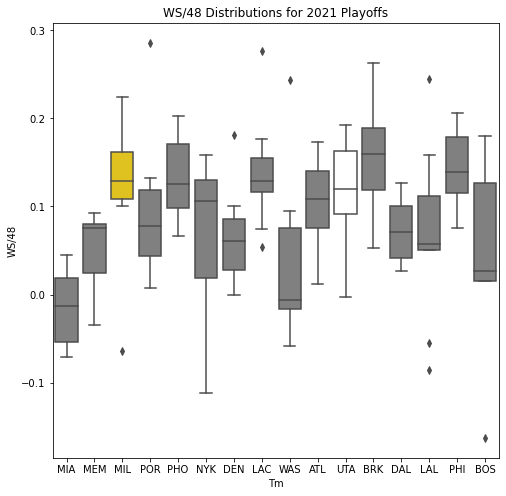
Next, we will look at the WSD of all the teams during the playoffs. The first thing we notice about the box plots is that there are few outliers. In addition, only 10 of the past 30 champions had an outlier on the upper portion of the box plot. Another important pattern is that a high median win share often correlated with a championship. In 22 of the past 30 champions, the median win share was among the top 3 of all teams in the playoffs.
Analysis of Regular Season Data
When analyzing the differences between the top teams and the worst teams, we do not want to focus on the significantly lower average win share that the worst teams. This is an obvious result, as the worst teams have the least wins. Rather, we want to analyze the distribution of win shares, which will allow us to compare the structure of each team. We find that the distribution of the top teams is much more spread out than that of the worst teams. In addition, we find outliers in many of the top teams but not in the bottom teams. These results signify that top teams must have at least one superstar, indicated by the outlier. In addition, they must have a couple other players supporting them. The players on the worst teams, on the other hand, contribute roughly the same amount to the team’s success. Even if these teams have an outlier, the rest of their team has extremely few win shares. While we often think that equal contribution by everyone on a team is beneficial, this is not the case in the worst teams in the NBA. The reason why this could be is that uniformity means there is no leader. Since no one is willing to step up and take charge, the team does not have someone to rely on during adversity. On the other hand, when we think of the best teams, one specific player comes to mind: the leader/ superstar. Michael Jordan, Kobe Bryant, Lebron James, etc. These are leaders that are able to unify their teammates and rally them during tough times to win a title.
A similar pattern can be found when comparing the champions and best-record teams from 1990 to 2003. The champions in all of these years except 1990 had an outlier, and in 11 of these years, the outlier was greater than the maximum win share on the best-record teams. This meant that having the stronger superstar was highly correlated to winning a championship. This was the era when prime Michael Jordan, Hakeem Olajuwon, Duncan Robinson, and Shaquille O’ Neal were dominating the league.
This changed when we reached the years 2004 to 2010. Instead of teams led by insanely talented superstars, the champions were more balanced teams that had many players making significant contributions. This is indicated by the champions having a higher median win share yet a lower maximum than the best-record team. The 2004-2010 era was also distinguished by the zone defenses that many teams used. Rather than letting a superstar operate one-on-one, multiple players would come to shut him down. This is why teams that did not depend solely on one player were able to succeed.
Lastly, from the years 2011-2021, there was no pattern we could find from the data, and there is one reason this may be the case. In recent years, superstars have been utilizing load management as a strategy to preserve their energy for the playoffs. As a result, they miss several games each season. Win shares is dependent on volume and games played, so a superstar playing less games will result in their win shares to be closer to the average win shares of the team. The absence of a superstar also affects the performance of the rest of the team. The rest of the starters will most likely contribute more to the team’s victories and close the gap between them and the best player on the team.
Analysis of Playoff Data
While the patterns we noticed differed by era, championship-winning teams had a consistent structure during the playoffs. We noticed that the performance of the team as a whole rather than just the top 2-3 players played a bigger role in securing a championship. This was shown by the two patterns we found. The low occurrence of outliers in the champions signifies more teamwork rather than letting one or two superstars carry the majority of the workload. In addition, an extremely high win share median in the champions indicates a greater performance by the team overall. The WSD has shown us that superstars cannot will a team to victory on their own, and they need their supporting players to play well if they want to win.
Conclusion
Win share distribution is not a perfect indicator of which team will win the championship. The patterns that we identified in this article are not present in every single champion. It just goes to show the unpredictability of the NBA season. If we were able to just look at stats and determine the championship team each year, it would not be fun to watch.
This does not mean we cannot keep trying to build a system that will give us the most accurate predictions. Looking at the distribution of win shares is a good step in the right direction, as it looks at how the team as a whole. We would like to find other ways we can analyze a team’s play style and find its correlation to their success. One statistic we are interested in looking at is the average number of passes before shooting per possession. This can give us an idea of how involved all of the team members are in their offense.
We also want to research the difference in the regular season environment and playoff environment more. We found the WSD of all teams during the playoffs, but we did not do the same for the regular season since there were too many teams. In a future study, comparing the WSD of teams during the regular season with teams in the playoffs will provide useful information.
For now, finding a reliable and foolproof method of predicting the NBA champion each year remains elusive. With more research, though, we will get closer and closer to this goal.


Comments