Behind the Board: A Statistical Deep Dive into NBA Draft Performance
- Bruin Sports Analytics

- Dec 25, 2025
- 7 min read
The NBA infamously played a Taco Bell commercial during the Denver Nuggets’ selection of Nikola Jokic with the 41st overall pick in the 2013. The Washington Wizards called Tyrese Haliburton on draft night in 2020 to tell him they would select him with the 9th overall pick, then called him back to let him know they were picking Deni Avdija instead. And in a win-now effort, the Indiana Pacers traded Kawhi Leonard’s draft rights to the San Antonio Spurs for George Hill in 2011. If these three examples tell you anything about the NBA draft, it’s that even experts make horrible decisions. The only guarantee after drafting a player is guaranteed uncertainty as to whether he will succeed. Year after year, prospects rise, others fall, and selections become the foundation of a team's identity for years to come. The Rockets, Grizzlies, and Thunder have used the draft to do just that: Houston selected an athletic alien in Amen Thompson to defend the perimeter, Memphis drafted Ja Morant to ignite their offense and crowd, and Oklahoma City used a plethora of picks to build the perfect team around Shai Gilgeous-Alexander. On the flip side, teams like the Kings, Hornets, and Wizards have used draft night to continuously draft underperforming players, thereby stalling growth and setting themselves back decades.
While scouting is arguably the hardest job in sports, advanced statistics have served as an amazing and efficient tool to counterbalance the emphasis on “passing the eye test”. However, by that same logic, it’s only fair to statistically analyze front offices’ success in drafting quality players. By creating enhanced VORP statistics and accounting for era and positional discrepancies, I’ve positioned myself to answer the question: Which teams, statistically, have been the most successful in the NBA draft since 2004?
I. Methodology
VORP:
Value Over Replacement Player (VORP) is a statistic that uses Box Plus Minus (BPM) as a basis to evaluate the value a player brings over a “replacement level player”. Replacement level can be loosely defined as a player on a league-minimum contract, or someone scraping the end of the rotation. The equation follows:
[BPM - (-2.0)] * (% of possessions played) * (team games/82) BPM uses a player’s box score information, position, and the team’s overall performance to estimate the player’s contribution in points above league average per 100 possessions played (Basketball Reference). VORP equalizes BPM over a full season to serve as a more comprehensive, holistic metric for player evaluation.
VORP per Season (VPS):
Since VORP is a cumulative statistic, the original dataset favored players with long careers rather than those with fewer, yet higher quality years. To even the playing field, I (a) calculated each player’s average VORP over their entire career to create the VPS metric, and (b) used VPS as the basis for each of the following metrics to ensure transparency and equality.
Value Over Average Drafted Player per class (VOADP):
VOADP measures the difference between a player’s VPS and their draft class’s average VPS. I first calculated the average VPS per class, then subtracted the class average from each player’s
individual VPS. VOADP is designed to evaluate not only the strength of each draft class, but also the quality of each prospect relevant to their talent pool.
Expected Pick Value (EPV):
EPV measures the expected VPS at each slot in the draft. To calculate this, I used a generalized additive model (GAM) to model a realistic expected value curve, which is not linear but curves with change; I attached a visualization of the model itself for reference. Change in Expected Pick Value (dEPV) measures the difference between a player’s VPS and their expected VPS relative to the pick they were selected at. To observe differences across eras, I also added a Decade Specific Change in EPV (dEPV_decade). I used the same modeling function and simply split the results up by decade, starting with the 2000s, then the 2010s, and finally the 2020s.

Weighted Change in EPV (WdEPV):
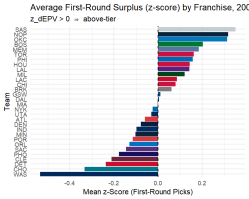
WdEPV is a supplemental metric to dEPV. I wanted to reward teams for finding stars outside of the lottery and in the second round. I created an add_WdEPV function that provides a square root bonus to each pick outside the lottery– picks in the mid to first round received bonus points ranging between 1.1-1.5, while picks in the second round would receive bonus points ranging between 1.6-2, with the 60th pick getting a two times bonus. To clarify, WdEPV does not penalize lottery picks in any way – it’s designed to only reward later selections for exceeding expectations. I also calculated the z-scores for different pick ranges to compare them against one another, with the five ranges being lottery picks (1-14), mid firsts (15-22), late firsts (23-30), early seconds (31-44), and late seconds (45-60). This approach shows which teams were consistently picking in the lottery and better clarify the overarching VOADP and dEPV success per team.
II. Findings

Which teams did the best job, overall, at drafting at each respective pick? The bottom teams included the Hornets, Wizards, and Kings, while the Thunder, Nuggets, and Spurs rounded out the top. Charlotte notably missed on Michael Kidd-Gilchrist and Adam Morrison, Washington with Jan Vesely and Otto Porter Jr., and Sacramento with Marvin Bagely III and Willey Caulie-Stein. All these players were taken within the first six picks, and each failed to live up to their expectations. Conversely, Oklahoma City’s success came from the selections of Kevin Durant, Russell Westbrook, James Harden, and Serge Ibaka. Denver’s success was mainly driven by Jokic’s WdEPV, which is nearly five points better than second place (Giannis Antetekumpo). San Antonio struck gold outside the lottery with picks such as Kawhi Leonard, Derrick White, and Dejounte Murray.

Which teams did the best job, on average, at drafting well relative to each class? Surprisingly, the Pelicans led in average VOADP, ahead of the Thunder and Spurs. Their success was driven by Chris Paul’s and Anthony Davis’s production relative to their respective classes: Paul’s 2005 class, along with Davis’s 2012 class, both ranked outside the top 10 in terms of class VPS. The selections of Zion Williamson, Trey Murphy III, and Herbert Jones also contributed to their success in this metric. For Washington, outside of Bradley Beal and John Wall, their next best prospects under this metric are Otto Porter Jr., Deni Avdija, and JaVale McGee, which isn’t a particularly noteworthy list. For Charlotte, their VOADP leaders, Jared Dudley, Raymond Felton, and D.J. Augustine, arguably makes a weaker list than Washington’s.

Which teams did the best at drafting in (a) the lottery, and (b) the first round? The most surprising team in the lottery graph is Miami, but this can be explained by volume – Miami has only had four lottery picks over the last 20 years, and two turned into all-stars in Bam Adebayo and Tyler Herro, while the other two, Justice Winslow and Michael Beasley, were major disappointments. The Celtics also benefit from the volume discrepancy; Jaylen Brown and Jayson Tatum are being compared to Marcus Smart, Kelly Olynyk, Aaron Nesmith, and Romeo Langford per the lottery grouping. Combine this with their late first round selections such as Rajon Rondo, Payton Pritchard, and Robert Williams (when healthy), and their high score starts to make sense. The only other notable surprise is Milwaukee, and how poorly they’ve drafted in the lottery despite team success. The Bucks struggled to find a star both before and after the 2013 draft; selections such as Jabari Parker, Yi Jianlian, Joe Alexander, and Thon Maker are notable flops, with Brandon Jennings, John Henson, and Andrew Bogut barely contributing.

Which players exceeded expectations, relative to their drafted position?
The names on the graph above are in the top 1.5% of the entire dataset in terms of these two metrics. Jokic stands miles ahead of the field due to his low draft position and high VPS. Some late draft steals featured include Jimmy Butler III, Ruy Gobert, Marc Gasol, and Jalen Brunson who all substantially exceeded their expected value. Underachievers include Anthony Bennet, Josh Jackson, James Wiseman, and Cody Willams (who arguably had the worst rookie season ever).

Since 2004, which teams have excelled with their draft picks?
The draft performance quadrant above uses the average WdEPV per pick as the y-axis and the break-even rate as the x-axis. The break-even rate calculates a team’s proportion of players whose VOADP is greater than 0. The size of each team’s circle reflects the number of picks they’ve had over the last 20 years.
The teams in quadrant one consistently picked players who exceeded their draft class expectations and EPV; these were the best teams at drafting. Teams in the upper left quadrant inconsistently picked players who exceeded their EPV. Teams in the bottom left quadrant were the worst at drafting–they consistently picked players who underperformed relative to their drafted position and their draft class. Finally, teams in the bottom right quadrant consistently reached on players, meaning they took average guys with higher picks.
The plot reinforces the conclusions made earlier–teams like the Thunder, Rockets, Grizzlies, Warriors, and Pelicans have all done a great job at drafting, while teams like the Hornets, Wizards, Kings, Suns, and Mavericks have all done a poor job. The teams hovering around the second quadrant but closer to y-axis are teams that drafted superstars, but weren’t successful as a whole; for example, the Bucks drafting Giannis Antetokounmpo, the Clippers trading for Shai Gilgeous-Alexander (immediately following the Hornets drafting him), and the Nuggets drafting Nikola Jokic. The Magic consistently reached on average to above-average players per class.
III. Discussion
What separates the winners from the losers
While it is great to pick quality role-players with later picks, the teams that succeeded the most in the dataset not only drafted well in late rounds, but landed one or two superstars in the lottery. The Thunder scored so well because they drafted three MVPs in the lottery, not because they picked Serge Ibaka 24th overall and Aaron Wiggins at 55, even though they outperformed their expected value. The Spurs are primed to jump further up the rankings not because Kawhi Leonard and Derrick White are stars, but because they picked Victor Wembanyama, who will be the best player in the league. The Hornets, Wizards, and Kings scored poorly not because they missed on players in the late-first and second round range, but because they failed to draft multiple stars in the lottery–each of those teams drafted less than 2 all stars who would play impactful minutes. The league has always been star driven, but so has “success” in the draft; as long as you hit a home run on a lottery pick, you can then focus on drafting players that mesh and form a supporting cast around your golden ticket.
IV. Conclusion
Areas of Improvement
One limitation is my failure to account for trades, and rewarding or penalizing teams who traded away talent on draft night. Specifically, teams like the Hornets, Pacers, and Sixers should have been penalized for trading away a superstar’s rights on draft night and received lower cumulative scores.
I plan on applying teams’ scores to my General Manager Success Index (GMSI) and evaluating specific regimes, uncovering which GMs helped or hurt their teams the most.


Comments