How Impactful Are Quality Relievers in MLB Playoff Runs?
- Bruin Sports Analytics

- Mar 28, 2022
- 5 min read
By: Alisha Dhar and Zayne Kratz
In most sports, postseason gameplay does not drastically differ in comparison to regular season gameplay. Sure, there is an increased intensity given the stakes – a single postseason loss in any sport could decide whether a team still has a chance at a national championship. In the MLB, however, gameplay is significantly different. In recent years especially, we have seen a significant increase in the use of relievers: pitchers that enter the game after the starting pitcher is removed (due to the starting pitcher’s ineffectiveness or injury, or a change in strategy by the coach). The charts below, for example, show the difference in innings pitched for starters in the regular season versus the postseason in both the American League and National League.

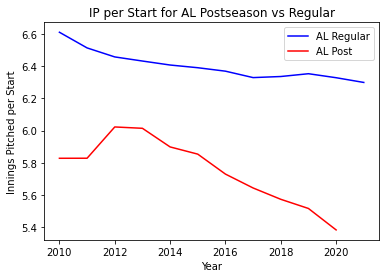


Looking at both leagues, the innings pitched per start in the regular season shows a slight decline, with the American League having a slightly higher average than the National League. The innings pitched per start in the postseason, however, shows a much steeper decline in the last decade with the average innings pitched in postseason starts being significantly lower than the average innings pitched in regular season starts. For the American League, regular season starts from 2018-2020 averaged 6.34, 6.35, and 6.33 innings, while postseason starts averaged 5.57, 5.52, and 5.38 innings in the respective years. For the National League, average regular season starts from 2018-2020 were 6.20, 6.19, and 6.17 innings, while average postseason starts were 5.46, 5.50, and 5.40 innings.
So, given this recent change, how does the quality of an MLB team’s relievers affect the team’s postseason success?
Comparing the Relievers of Postseason Teams
To understand the effect of the quality of a team’s relievers on their postseason success, we can look at statistics used to measure pitching performance, specifically in the last few years.

The chart above shows a comparison between a bullpen’s cumulative ERA (Earned Run Average) and the furthest round a team makes in the playoffs (with 1 being the Wild Card round, 2 being the Divisional Round, 3 being the League Championship, and 4 being the World Series). We can see a negative correlation between the two, showing that teams that make it further in the postseason tend to have lower ERAs.

The Playoff vs Strikeout rate graph shows the number of strikeouts per inning by team, and the positive trendline shows that the bullpens of teams that made it further have a higher strikeout rate.

This third chart, however, which measures the allowed opponent batting average vs playoff round, only has a slight dip in the allowed batting average as you get deeper into the playoffs. In combination with the ERA which was discussed earlier, this yields an interesting result: although the amount of batters getting hits stays relatively constant, the better teams seem to have more efficient bullpens, because they are able to let up fewer runs. This further indicates that ERA is likely a more deciding factor in the success of a playoff team, but also shows that the number of strikeouts has some effect as well. The number of runners getting hits is still similar, but because the strikeout rate of teams that went further in playoffs is higher, the runners might not be advancing around the bases to get into scoring position, leading to lower ERAs.
What could explain the increased need for quality relievers?
One possible reasoning for the increased need for quality relievers is the performance of the starting pitchers. We took a look at the performance of starting pitchers in the regular season in comparison to the postseason to determine if the inability for starters to perform in the postseason forces coaches to turn to relievers.

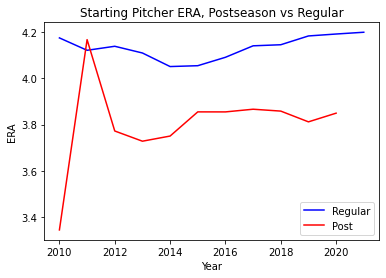

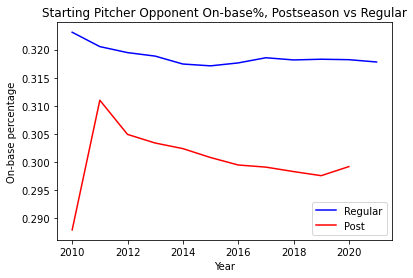
Both the ERA and opponent on-base percentage charts have similar trends: since 2012 both charts have relatively stagnant trends. Starting pitchers have also consistently had lower ERAs and opponent on-base percentages in the postseason compared to the regular season. Looking at ERA, the regular season statistics from 2018-2020 were 4.14, 4.18, and 4.19, and the postseason statistics in the same years were 3.86, 3.81, and 3.85 – this is an average of .33 less earned run average in the postseason than the regular season.
These statistics do not show poor performance from the starting pitchers – one potential reason for the increased reliance on relievers. Another potential explanation is changes in coaching strategies.

This graph shows the comparison between the ERAs of starting pitchers and relievers. While relievers consistently have lower ERAs than starters in both the regular season and postseason, this is more influential in the postseason. In the regular season, relievers tend to have lower ERAs because of shorter outings: they are put into the game to face specific batters or to throw off batters with a pitching change. In the postseason, these changes matter more – because coaches in the postseason may want to prevent the opposing team from facing the same pitcher more than once or twice, relievers are used more. The increased innings pitched for relievers increases their importance to a team’s success, reaffirming why teams with more postseason success had higher quality relievers.

A note, however, is that the lower statistics in playoffs are likely due to both the increased stakes of playoff play and the fact that the better teams (teams that won the most games in the regular season), are the only teams competing. These lower statistics are also seen among relief pitchers (shown above), meaning that the relief pitchers in the postseason are also performing better.
Conclusions
There seem to be many possible factors which lead to the increased usage of relievers in the postseason, but based on our data and graphs, it holds that teams with better performing relievers will make it farther in the playoffs on average. Once you get to the playoff level, only the best teams with the best players across the board are competing. Because of this, the batting average that relievers give up is about the same regardless of the round the team reaches, because all of the hitters are of the highest quality. However, what separates the teams that make it to the last rounds of the playoffs from those that make an early exit is that the relievers of teams that make it furthest have a higher strikeout count, so hitters are making less contact, and a lower overall ERA, so they are more efficient. With all of these factors in consideration, the teams whose bullpens perform the best make it the furthest in the playoffs, and only the most elite bullpens can get a team to the World Series.
Sources
R library Lahman
Comments