Predicting the Group Stages of the 2022 FIFA World Cup
- Bruin Sports Analytics

- Jun 22, 2022
- 8 min read
By: Steven Lu Chen and Anvesha Dutta
Introduction
Amongst the world’s seemingly endless number of competitions in the beautiful game, there is absolutely no greater prize than the FIFA World Cup. In the competition’s nearly one hundred years of history, just eight nations and 445 players have earned the title of world champions. This fall, the world’s eyes will turn to Qatar as the tiny Middle Eastern nation plays host to the twenty-second edition of the World Cup. With the final two spots in the tournament having been decided this month, the stage appears to be entirely set. In this article, we aim to provide an empirical answer to the question on everybody’s minds: who will be making it to the knockout stages?
Methodology
A total of 32 national teams will compete in this year’s World Cup; the groups are formed by partitioning these teams into eight groups of four teams each. Each team will play three matches in the group stage: one against each other team in its group, meaning a total of six matches will be played per group. Teams receive three points for a win, one point for a draw, and no points for a loss, and the top two teams in each group advance to the round of sixteen. We aim to simulate the results of the group stages using a formula that returns the expected points gained by a team in a match against a given opponent.
We identified five metrics that went into creating the formula:
FIFA World Ranking points: The total number of points attained by a given team, calculated by FIFA to determine a comprehensive ranking of its member federations. Ranges from 1832.69 (Brazil) to 776.97 (San Marino). Values are accurate as of the rankings published on March 31, 2022.
Points per game in qualifying: The number of points per game attained by each team in its confederation’s final qualifying round for the 2022 World Cup. Ranges from 0 to 3. Note that these are not the same “points” as those used in the FIFA World Rankings. The number of matches played by each team differs based on the team’s continental confederation. The qualifying rounds selected for these calculations are as follows:
UEFA (Europe): First Round; each team plays either 8 or 10 matches, depending on its group
CONMEBOL (South America): First Round; each team plays 18 matches
Note: One match between Brazil and Argentina was suspended and will be replayed in September 2022. As a result, Brazil and Argentina have played only 17 matches each, instead of 18. The result of the match will not impact the final standings in any way.
CONCACAF: Third Round (Octagonal); each team plays 14 matches
CAF: First Round; each team plays 6 matches
AFC: Third Round; each team plays 10 matches
OFC: Both Group and Final Stages; winner plays 5 matches
Note: Because New Zealand is far and away the strongest team in the OFC, they frequently defeat teams by a wide margin in the group stages of qualification. Thus, we also included the two matches played in the final knockout stages of qualifying against Tahiti and Solomon Islands.
Average goal difference in qualifying: The average margin of victory of a team against its opponents in qualifying. Only two teams, Uruguay and Peru, had nonpositive average margins of victory.
Average opponent ranking in qualifying: The average number of World Ranking points held by a given team’s opponents in qualifying. For instance, France was placed in a qualifying group with Ukraine, Bosnia and Herzegovina, Finland, and Kazakhstan. France’s average opponent ranking would be the average FIFA ranking of the above nations.
Random element: Upsets are common in soccer, especially in one-off matches like those in the World Cup. Including a randomly selected number will account for the inherent randomness of the game of soccer, and changes the result slightly with each iteration of the simulation.
The procedure for calculating expected points is as follows:
First, we will calculate the raw expected points won by the home team according to the following formula:

where
• P represents the points per game in qualifying won by the home team.
• Ω represents the home team’s average opponent ranking in qualifying.
• R represents the home team’s FIFA World Ranking Points.
• D represents the home team’s average goal difference in qualifying.
Values denoted with the subscript 0 represent the same metrics, respectively, but for the away team.
The expected points are calculated for each of the six matches in a group, placed in a list, and are then normalized using min-max scaling according to this formula:

Note that the normalized values, which are supposed to fall between 0 and 1, are multiplied by a factor of 3 to reflect the maximum number of points a team can expect to win from a single match.
Finally, a random element α is added to each normalized ε value according to the following parameters:
• If ε = 3,
→ -1 < α < 0
• If ε = 0,
→ 0 < α < 1
• If 1.5 < ε < 3
→ ε - 3 < α < 3 - ε
• If ε < 1.5
→ - ε < α < ε.
Note that the “home” team referred to in the formula is determined based on the official World Cup draw. For instance, for FIFA’s administrative purposes, Senegal is listed as the home team for its opening match against the Netherlands, even though the match will be played in Doha. This is relevant because the formula will return a different result if the metrics for the home and away teams are swapped, even if none of the values have actually changed. Therefore, the expected points for the home team will be calculated using the formula, and the expected points for the away team will be calculated by subtracting those of the home team from 3.
Results
We implemented this formula in R to run 10,000 simulations of each group stage match, and calculated the simple mean of the number of points won by each team. Data visualizations were created using the ggplot2 package, and the point totals displayed in the tables were rounded to five significant figures. The results are as follows:

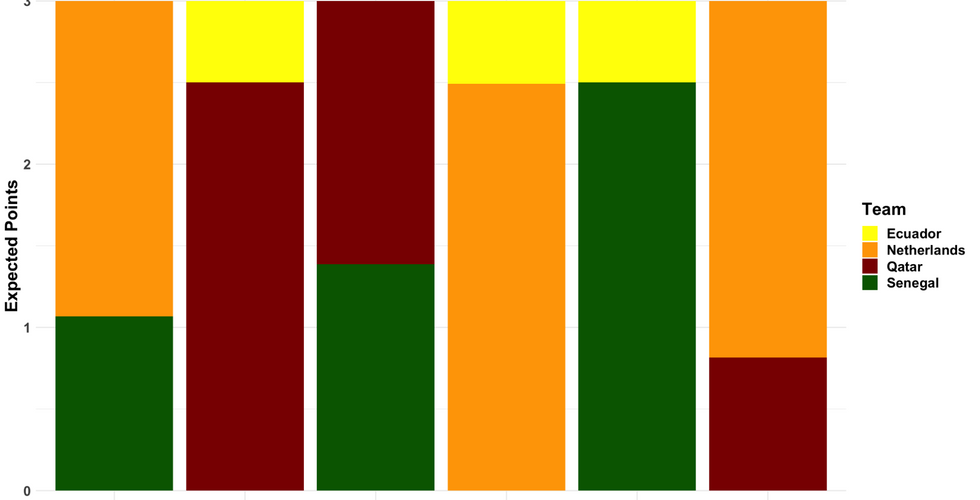


(Click on images to expand them)
Tidbits and takeaways
Despite being the defending World Cup champions, France garnered the fewest total points out of any team projected to top their group, likely due to having to share Group D with Euro 2020 semi-finalists Denmark, who won 27 out of a possible 30 points in their qualifying group.
Hosts and defending Asian Cup champions Qatar were projected to win the most points out of any team not projected to advance to the Round of 16, with 4.9271. Although they finished third in Group A, their point total would have been enough points to advance in groups B, E, and G!
Perhaps surprisingly, Morocco were picked to win a group consisting of the world’s second best team in Belgium, Croatia, runners-up in the previous World Cup, and Canada, who finished first in a grueling CONCACAF qualifying campaign.
Costa Rica and Australia, who claimed the two final spots in the World Cup by winning their intercontinental playoff matches, both finished bottom of their groups. Australia won the fewest points out of any team in the tournament.
Iran was the only Asian team predicted to advance, which would mark the first time they had progressed beyond the group stage.
Unfortunately for the United States, they are picked to finish bottom of Group B, and are given but a miniscule chance by the model to defeat England in match B4.
Poland have been picked to win Group C, a feat they haven’t achieved since 1982, when they finished third and equalled their best ever result at a World Cup.
Korea Republic (South Korea) won the most points of any team predicted to finish last in their group, but even then would only have finished higher than fourth in one other group - Group C.
England were predicted to win the most points out of any team in the tournament. Not only are the Three Lions ranked by FIFA as the fifth-best team in the world, they also enjoyed a stellar, undefeated qualifying effort that was highlighted by a 10-0 dismantling of San Marino.
Based on these results, the ensuing Round of 16 matchups would be as follows:
Netherlands (A1) v. Iran (B2)
Poland (C1) v. Denmark (D2)
Germany (E1) v. Belgium (F2)
Brazil (G1) v. Portugal (H2)
France (D1) v. Argentina (C2)
England (B1) v. Senegal (A2)
Morocco (F1) v. Spain (E2)
Uruguay (H1) v. Switzerland (G2)
Limitations of the model
Of course, it is impossible to predict the result of any match with perfect accuracy. Even so, there were a number of factors that may have contributed to skewed results from the model. A cursory glance at the results suggests that several countries were predicted to perform much better or worse than fans and analysts might expect. For instance, the United States and Canada are both teams that are heavily favored to advance to the knockout stages (although this in itself may be affected by the inherent bias present in the media as a whole), but were both predicted by our model to finish last in their respective groups by a sizable margin. There are a number of reasons this may be the case:
Changes in squad composition between qualifying and the tournament itself
All of the data used to calculate a team’s expected points is based on the team’s statistics in qualifying. It is possible that a team has made drastic changes to tactics and coaching since the conclusion of qualifying, or that players have joined and left the national squad due to injury or other external factors. An example of this is the case of Chelsea winger Hakim Ziyech’s relationship with the Moroccan national team; after a falling out with his manager, Ziyech abruptly announced his retirement from the national team in February 2022, ending any chances of him playing in the World Cup.
Over-emphasis on a given component used in calculating expected points
When creating the formula for expected points, we adjusted the points per game won by a team in qualifying by using the predicted margin of victory (which is simply the difference in goal difference between two teams) as a multiplier. However, goal difference may not have been the best metric to use as it loses much of its meaning after a certain point.
To illustrate this effect, we again look at England’s massive 10-0 victory over San Marino in qualifying. Poland, who were in the same qualifying group as England, also played San Marino, and won 7-1. Without a doubt, England and Poland are both leagues ahead of San Marino, but how much does this tell us about England and Poland relative to each other? England won by ten goals, but Poland only won by six - meaning England’s goal difference increased by four more goals than Poland (which is still a huge margin of victory in soccer!), despite both teams dominating their opposition. Thus, these largely meaningless goals would have skewed the calculations, since goal difference is weighted evenly regardless of the opponent.
Large discrepancies in qualifying procedures across confederations
Teams in varying confederations can play in qualifying procedures that differ vastly not only in the number of matches played and the overall quality of opposition, but also in miscellaneous factors such as travel time between matches, supporter behavior and hooliganism, and refereeing.
Nations with the opportunity to do so often host home matches in conditions to give their team an advantage; for instance, the Canadian team sometimes chooses to play matches against Central American teams in snowy Edmonton, forcing their opponents to adjust to the frigid temperatures. In Asian qualifying, away matches in North Korea can be notoriously intimidating and difficult for obvious reasons.
These differences can massively impact a team’s performance in qualifying, whether for the better or worse, but would be immediately canceled out in Qatar, as all teams are put on a level playing field at the World Cup.
Conclusion
All things considered, our model provided a novel, unique, statistics-driven way to predict the results of an ultimately unpredictable competition. The results of these simulations might not have matched up exactly with most experts’ picks to make it out of the groups, but at the end of the day, it’s highly unlikely that anybody picks the result of all forty-eight matches correctly. One can only hope to get as close as possible to that figure, and in the meantime, we can only eagerly anticipate the events of this winter to see just how well we have done.
Sources
FIFA World Rankings: https://www.fifa.com/fifa-world-ranking
World Cup Qualifying results and statistics: https://fbref.com
Github repository: https://github.com/anveshaa24/Bruin-Sports-Analytics-Spring-Project
Comments