Predicting the 2023 NHL Stanley Cup Winner
- Bruin Sports Analytics

- Mar 30, 2023
- 14 min read
By: Albert Carreno
As we reach the end of winter and enter the start of spring, hockey fans only have one thing on their minds: the NHL Stanley Cup playoffs. In 1917, the NHL was established as a professional sports league, but only included six Canadian teams. 106 years later, the league has come a long way, now boasting 32 different teams: 7 from Canada and 25 from the United States. Back when the league was first established, there were not many hockey fans. It was a relatively new sport and all the interest (at least in the US) was on sports like baseball. However nowadays, playoff games amass an average viewership of nearly 5 million people, which rivals the average viewership of MLB playoff games. Regardless, the millions of hockey fans out there eagerly awaiting the playoffs are also likely debating which team is going to win the Stanley Cup this year, bringing me to the main subject of this article. Compared to previous years, the competition is stiff this season in the NHL. An incredibly talented and stacked Eastern Conference opposite an exciting, wide open western conference promises a lot of late season and playoff drama. Among the teams this year, there seem to be several favorites: the Boston Bruins, who are putting together a historic season and challenging the best regular season record in NHL history; the Toronto Maple Leafs, who are backed by superstar forwards like Auston Matthews, William Nylander, and Mitch Marner and were incredibly aggressive at the trade deadline, acquiring much needed defensive pieces; and of course you can’t forget the Colorado Avalanche, the reigning champions who still boast an excellent squad powered by a dynamic offense. Well, I’m here to tell you that I don’t think any of these teams will take home the championship. I’m here to present the case for the Carolina Hurricanes, who I believe have the greatest chance at winning the Stanley Cup.
However, before I can substantiate my bold claim that the Hurricanes are the team most likely to win it all, we need to explore an important question: what goes into a Stanley Cup caliber team? To do this, I have compiled a significant amount of data and information on the last 15 Stanley Cup winners (advanced stats and analytics are only available from the 2007-08 season onwards). We will use this data to determine what factors are most important in evaluating whether a team has what it takes to win the championship. The first few metrics that stand out are goals per game, goals against per game, and Corsi%. The former two statistics just indicate the average amount of goals a team scores and allows per game (not counting overtime). I made sure to only look at the even strength versions of these two statistics, so goals scored on the power play or penalty kill do not count in the calculations. In hockey, when a player takes a penalty by breaking a rule of some kind, typically involving unnecessary physical contact or inappropriate use of his stick, he is sent to the penalty box for (usually) two minutes. During this time, the team is not allowed to replace the player in the box, giving the opposing team a one-man advantage and making it easier for them to score goals. This is why even strength statistics are needed here; otherwise, the statistics would not be as reflective of a team’s true ability to score and prevent goals since they are either at a significant advantage or disadvantage. As for Corsi%, it is a bit more complex, but still very easy to understand. What this metric does is serve as a proxy for puck possession; it is the ratio of all shot attempts, including blocked shots and shots missing the net, taken by a team to all shot attempts taken by their opposition. Now that we understand what these statistics do, here are a few histograms demonstrating how the last 15 Stanley Cup winners performed in them.


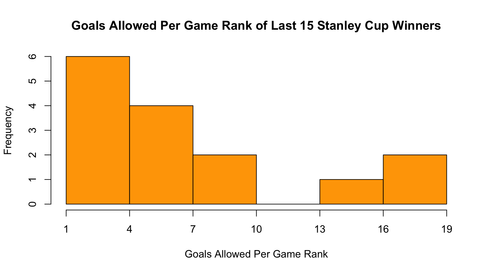


As we can see, an overwhelming number of Stanley Cup winners over the last 15 years were in the top 10 for goals per game and goals against per game at even strength as well as Corsi%. 11 out of 15 were in the top 10 for goals per game, 12 were in the top 10 for goals against per game, and 11 were in the top 10 for Corsi%. There are two important conclusions we can gather from this data. First is that balanced teams are in a better position to win; top heavy teams that exclusively rely on offense and brute force or defensive minded teams that lean a lot on their goaltenders and blocking lots of shots tend to not come away with the Stanley Cup in general. Secondly, it is that puck possession and shooting tenacity matters. A lot of these Stanley Cup teams gave themselves an opportunity to win every game by taking a lot of shots and not giving the puck up to the opposition that easily. They were determined to get shots off and consistently test the goaltender they were facing. To accomplish this, it seems that they were able to carry the puck into the offensive zone and keep it there for longer periods of time than their competition. What’s more, many of these teams also seem to have played a highly efficient and structured defensive game as well by not allowing opposing skaters to even get many shot attempts off. Since Corsi is a ratio, we can conclude that these teams were just as good at pressuring their opponents when they had the puck and not allowing them many scoring chances, thereby controlling ownership of the puck most of the game. With these insights in mind, let us now briefly focus our attention on how much goaltending matters in winning the Stanley Cup.
Scoring goals is not the only thing that matters in a hockey game; solid goaltending is paramount and can often result in teams being able to win games without having to score as much compared to teams with lesser goaltending. This same logic applies to the playoffs as well; having a great netminder that gives his team a chance at winning every game by saving all the shots he needs to save takes the pressure off the forwards to rack up the score and allows them to play a more relaxed game. A prime example of this idea is Jonathan Quick who was the centerpiece of the Los Angeles Kings in their Stanley Cup victory in 2012. He finished as the runner up for the Vezina Trophy, which is awarded to the league’s best goalie; he almost single handedly carried the Kings to the playoffs. The Kings averaged the second lowest amount of goals per game in 2012, and yet still found a way to win the Stanley Cup. A lot of this can be attributed to Quick’s consistently stellar goaltending. The histogram below shows how the last 15 Stanley Cup winners ranked in terms of save percentage in the regular season.

11 out of 15 teams ranked in the top 10 for save percentage (ratio of saves made on shots on goal to total shots on goal faced), which is no small number. Nearly every team seems to have had dependable goaltending that made the saves they needed to make it hard for the other team to score. So, from what we have seen thus far, some of the most significant qualities of Stanley Cup winning teams include puck possession, goal prevention, reliable goaltending, and an offense that can produce when the defense or goaltending is not at its best. With all of this in mind, it's time to bring the discussion into the present and evaluate why the Carolina Hurricanes stand out as the team that best possesses the qualities we are looking for.
Looking at the season leaders in basic statistics for the NHL this season, the Hurricanes are near the top or at the top of the leaderboards for all the metrics being considered here. The Hurricanes rank first in Corsi% by a wide margin at an even 60%, which is nearly 3% higher than the second place Calgary Flames (57.19%). 3% may not sound like a substantial amount, but it makes a large difference; a touch above that same 3% is what separates the 3rd place Florida Panthers (53.99%) from the 18th place Minnesota Wild (50.74%) in Corsi% at even strength. In average goals scored and goals against per game, the Hurricanes rank ninth (3.29) and second (2.54), respectively. They are one of only four teams along with the Boston Bruins, Toronto Maple Leafs, and New Jersey Devils to rank in the top 10 for both categories, demonstrating that they are a balanced team that can defend just as well as they can score, which we have mentioned as being a critical trait for a Stanley Cup team to have. The only major category we’ve discussed so far where the Hurricanes fall short is in save percentage. They rank middle of the pack at 14th with a .902 save percentage on the season. While this ranking is not objectively bad, it’s still not what we would expect from a Stanley Cup caliber team, right? Well, before we jump to that conclusion, there are a couple of things that must be considered.
First and foremost, Carolina’s starting goaltender Frederik Andersen has been injured most of the season and has only been able to make 20 starts for his team this year. Andersen has consistently been one of the better goaltenders in the league since he broke into the NHL during the 2013-14 season, with a career .916 save percentage per season that is better than those of two of the previous five Vezina trophy winners (and it is also only .01 and .03 off the career save percentages of two others). Before he returned, the Hurricanes were forced to experiment with other options in net, but none are anywhere as good as Andersen. The other thing to consider is that even if the Hurricanes are not a top 10 team in overall save percentage, they still make the saves that count the most. They have the ninth best high danger save percentage in the league this year at .803. A recent development in advanced hockey tracking analytics has been the implementation of devices used to track the location of shots that are taken over the course of a game. Each shot that is taken is assigned a value in accordance with where the shot was taken from. A value of 1 indicates that the shot was taken from a “low danger” location, a value of 2 indicates it was taken from a “medium danger” location, and a value of 3 indicates it was taken from a “high danger” location.
As the picture here shows, high danger shots are shots taken close to the net in the slot areas (zones right in front of the goaltender extending towards the middle of the faceoff circles), medium danger shots are taken from a little further out to the sides of these slot areas and from further inside the point (the area right inside the blueline that marks the offensive zone), while low danger shots are taken from the fringes of the offensive zone towards the sides or the very top of the point. As you can imagine, high danger shots are much harder for a goalie to stop because they have much less time to react and there are usually more bodies around the front of the net, making it harder for the goalie to track the puck. Consequently, high danger shots account for most of the goals scored in the NHL. As such, if a goalie can stop these high danger shots at an exceptional rate, he is a valuable asset to his team. The histogram below shows how the previous fifteen Stanley Cup champions performed in high danger save percentage.

While not as obviously correlated with winning the Stanley Cup as average goals against per game or Corsi%, high danger save percentage can still serve as an important x factor and significant enough piece of the puzzle in determining whether a team has what it takes to win the Stanley Cup. Nine of the previous fifteen winners ranked in the top 10 for high danger save percentage. This proves that most of the time the teams that won it all had goaltenders that could come up with unlikely saves when they needed to stop major offensive threats from the opposition in their tracks. And as aforementioned, the Hurricanes are among the best in this regard. So, it is evident that come the playoffs, making these saves on grade A opportunities for the other team is no doubt going to come in handy for them.
Now, let’s return for a minute to the importance of puck possession. We’ve already seen that the Hurricanes rank number one in Corsi% at even strength, but what we have yet to mention is just how often they are spending time in the offensive zone as well as how efficient and steady their scoring lines and defense is compared to the rest of the league. The NHL no longer keeps a public record of official team offensive zone times, but we can still estimate fairly accurately how often a team is spending time in the offensive zone by using just one statistic: offensive faceoffs per 60. This simple metric just tells us how many faceoffs, on average, a team is taking in the offensive zone per game. The logic is easy to follow: if you are taking more offensive zone faceoffs, you are spending more time in the offensive zone. The Hurricanes rank at 21.35 offensive zone faceoffs per game, just barely behind the first place Calgary Flames who average 21.41 per game. The average team only averages 17.5 per game, meaning the Hurricanes average about 4 more, amounting to multiple more minutes spent in the offensive zone per game, and in a sport where there are only 60 minutes of regulation, multiple minutes really can have a significant impact on a team’s chances of winning since they are giving themselves more opportunities to score by being in the offensive zone with the puck more often. The fact Carolina ranks so high in this statistic should not be all that surprising though: they also have the best takeaway to giveaway ratio in the NHL this year at 57.23%, meaning their defenders are great at taking the puck away from opposing forwards and that their forwards are good at moving the puck up the ice and entering the offensive zone without being stripped of the puck as often as most teams. All of this speaks to the Hurricanes’ efficiency as a unit and smart hockey sense. They make very few mistakes in their own end and always give themselves chances to score.

That said, if you aren’t yet convinced, there is still one more thing that is worth pointing out. MoneyPuck, a hockey website dedicated to providing fans with all kinds of basic and advanced metrics to help them further understand the game and evaluate the performance of players and teams, has power rankings that are updated daily based on a win probability model. There is a “power score” assigned to each team in order to rank them that is based on the model. As the chart above shows, Carolina is ranked as the number one team with a power score of 63.13%, and frankly, it isn’t close. The second place Boston Bruins sit nearly 5% back at 58.2%. Now, let’s discuss the significance of this ranking and what it can tell us about the Hurricanes. The model that the power scores are based on takes many different factors and types of advanced data into account, but for our intents and purposes, all that matters is the main component of the model: score and flurry adjusted expected goals%. This highly predictive metric is the most weighted variable in the model. Here’s how the metric works: at even strength, each shot a team takes is assigned a probability of it being a goal. Then, every individual probability is added up and divided by the same sum of probabilities plus those of that team’s opponents. The metric takes shot danger and shot quality into account, so the better the opportunity, the higher the probability it will be given of being a goal. That’s how the math for the formula works. However, there’s two additional details about it that make it more reliable than your average stat: it is flurry and score adjusted. The probabilities for each shot after the first shot in a “flurry” of shots are not counted when summing everything up. This is because a flurry, or string of consecutive shots, almost always occurs because of a rebound, or when a goalie blocks, but can’t hold on to the puck, and so it ends up near the opposing skaters. As you can guess, rebounds often occur right in front of the net, so each successive shot in a flurry is likely to have higher probabilities than the last. The problem though is that rebounds are unpredictable and unsustainable; you cannot rely on them to predict future outcomes as they speak more towards a team’s luck than actual shooting skill. The score adjusted part of the metric is much more straightforward: it just means that this metric is adjusted to give more credit to the away team and teams with large leads; when a team is leading by a lot, they sometimes “coast” a little, but that does not mean they are necessarily playing poorly, so this reflects that. Anyway, now that flurry and score adjusted expected goals% has been explained, you can see the predictive power of the metric for yourself with the scatterplot below.

Depicted in this plot is the score and flurry adjusted expected goals% for every team in the regular season over the last five full seasons (the 2019-20 and 2020-21 seasons were interrupted by the pandemic) on the x axis, and each of those team’s total regular season points on the y axis. A team gets two points for each win, zero points for each loss in regulation, and one point for each loss in overtime. Just by looking at the plot, we can already see a strong positive correlation between a team’s flurry and score adjusted goals% and the amount of hockey games they win. The underlying regression analysis backs this assertion up: the line of best fit for this scatterplot has a regression coefficient(r) of 0.71 and an r-squared of 0.5. The regression coefficient serves as the slope of the line of best fit for the scatterplot and tells us that for every unit change in the independent variable (score and flurry adjusted expected goals% in this case), there is a change of 0.71 in the positive direction for the dependent variable (points in this case). Meanwhile, the r-squared is a measure of how much of the variance in the dependent variable is explained by the independent variable. As such, we can conclude that about half of the variance in points is explained by flurry and score adjusted expected goals %. All this to say, this metric is fairly predictive of a team’s success and should be considered when evaluating which team has the best odds of winning the Stanley Cup. It is the most important model in determining the MoneyPuck power rankings, and this model, while far from perfect, is still much better than blind guessing: according to the site, the model predicted 64.1% of games correctly last season. This season, the Hurricanes are number one in flurry and score adjusted expected goals% at 60.85% this season, outperforming the second place Toronto Maple Leafs by about 6%. This tells us that they are creating many good scoring opportunities for themselves on offense compared to their opponents and speaks to their great playmaking and elite defensive abilities in limiting quality scoring chances for other teams. This makes even more sense when you consider that they have three offensive lines (combinations of three forwards on the ice together) in the top 15 for expected goals% with a minimum of 150 minutes played together (the flurry and score adjusted version is not available for offensive lines yet). No other team has three lines in the top 15.
For all these reasons, it seems to me that the Carolina Hurricanes are the favorites to win the Stanley Cup this year, at least from a statistical and data driven perspective. They are a team that is often mentioned as being very good, but not one that is talked about as often as more dynamic teams like the Bruins, Maple Leafs, Avalanche, or Devils. They fall under the radar a bit because their roster is incredibly deep with few holes, but it lacks true star power. Their best offensive player right now, first line center Sebastian Aho, is barely maintaining a point per game pace (a point is either an assist or a goal, they each just count as one point). Despite this, they are an incredibly consistent team with shooting tenacity, unparalleled puck possession, offensive depth, defensive prowess, and goaltenders that can at least make the big saves more often than not. All these strengths are what have propelled them to having the second highest team point total in the NHL so far, and having not won a title in nearly 20 years, they are just as hungry as any other team to win the Stanley Cup. Only time will tell if they are up to the task, but I think it’s fair to say that the Hurricanes are going to be firmly in the running, and aren’t going to back down without a fight.
All statistics and data were taken from MoneyPuck, Natural Stat Trick, ESPN, or Hockey-Reference.
Comments