The Hidden Dynamics Beneath Olympic Swimming
- Bruin Sports Analytics

- Sep 5, 2023
- 5 min read
By: Jodie Chen
Intro
With its blend of power, endurance, and precision, the sport of swimming pushes athletes to their physical and mental limits, leaving spectators awestruck as records are shattered and new champions emerge.
However, beneath the surface of this impressive spectacle lies an assembly of factors that greatly influence an athlete's performance in the pool. In this article, we delve into factors spanning biological traits–height and age–as well as trained abilities like reaction time and weight (measured as BMI) to examine how much they contribute to success in Olympic swimming.
We aim to answer: what kind of relationship do these factors have with race time? Can we rank their overall order of importance, or do they depend on the length of the race? How do they differ among races of different lengths?
To explore these questions, I aggregated data from the 2008, 2012, 2016, and 2020 Olympics for the Men’s Freestyle event and made the following graphs for each race–50 m, 200 m, 1500 m:
Scatter plot and box plot to examine age vs race time when age is a continuous or categorical variable
Scatter plot to examine reaction time vs race time
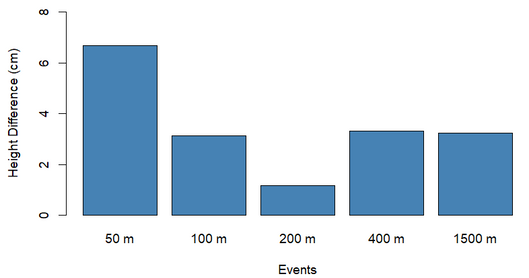
Side-by-side bar plots that compare the average height of all swimmers and the average height of finalists across different races
Side-by-side bar plots to compare the average BMI of all swimmers and that of finalists across different races
Age Analysis
During the formative years of an athlete's career, youth can often be associated with exceptional potential and rapid progress. Younger swimmers, endowed with high energy levels and the ability to recover quickly from injury, possess a remarkable capacity for physical adaptation and skill development. Nevertheless, as athletes progress through their careers, a shift occurs in the relationship between age and performance. Experience, refined technique, and strategic race management become crucial factors in maintaining peak performance. Older swimmers, armed with years of training and competition experience, may exhibit a level of mastery that surpasses their younger counterparts. Let’s take a look at the following line graphs to see if they reflect this:


From the line graph, there seems to be a negative relationship between Age and R1 swim time: as age increases, swim time decreases; however, the correlation gets weaker as the distance of the event increases. So this relationship is primarily observed for the 50 and 200 m freestyle events.
Can we observe the same pattern if we looked at age as categories? Which age group swims the fastest? And does it vary depending on the distance of the event?
Let’s compare the average race time (in yellow) for the three age groups in each event.


For the 50 m and 200 m event, participants younger than 21 had the slowest swim time while the two other age groups had roughly the same time. Contrary to the line plot, there is not a negative relationship between the two variables: participants younger than 21 perform considerably worse, perhaps due to lack of experience or that it is their first time competing. For shorter events, age does not seem to directly correlate with swim time which makes sense since shorter events don’t require as much stamina or endurance; age in these events seems to only indicate experience or the lack thereof.

For the longest event however, the oldest age group swam almost just as slow as the youngest age group or (potentially the least experienced age group). Athletes in their 30’s have a harder time maintaining their speed throughout the race than their younger counterparts resulting in longer race time. Interestingly, the 14-19 age group did not swim faster or even just as fast as the 20-24 group–this could be due to overall lack of experience that made them swim just as slow as the oldest group. There isn’t a strictly positive correlation between age and race time; age seems to be relevant only for athletes 20 and older competing in longer events.
RT Analysis
A faster reaction time off the starting block can provide a competitive edge, enabling swimmers to gain an early lead especially in races where every millisecond counts. From the graphs, there is a moderately strong positive correlation for the 50 m, meaning that athletes that have faster reaction time tend to have a faster swim time. As the distance of events increases however, reaction time matters less, indicated by the smaller correlation coefficient. This makes sense since athletes competing in shorter events have less time to recover from a slow start so every millisecond counts. As distance increases, other factors become more important than something that makes at most a second difference like reaction time.


Height Analysis
Athletes can swim faster with a taller stature as they can finish the race with fewer strokes with their longer limbs and reach the finish wall before anyone else. But how does this relationship vary across different events? Let’s compare the average height of finalists (top eight) and all athletes in each race.
Overall, the finalists are taller than the typical competitor across all events. But, the difference is significant only for 50 m (the shortest event)--6.5 cm. For the other events, the difference is negligible. Height is an evident factor in the 50 m event, but it doesn’t seem to be as relevant for longer events.


BMI Analysis
The Body Mass Index (BMI) relates height and weight to measure amount of body fat. Finalists have roughly the same BMI as the other athletes across all events with a BMI of about 23-24. Thus, there is no relationship between BMI and race time.

Conclusion
Overall, there is not one dominating factor among all events. The importance of age, reaction time, and height varies depending on the distance of the event. For shorter events like the 50 m, a faster reaction time and taller stature are especially important in obtaining a faster race time, while age doesn’t play a role at all. For longer events like the 1500 m, age is important–athletes 25 years and older have worse race times than the younger competitors. Reaction time becomes less important as the distance of the event increases. While ultimately all the factors mentioned are correlated with race time except BMI, it’s important to note that some factors such as age become important only after a certain threshold rather than having a continuous linear relationship with race time. For example, age and its implications of fitness capacity only seems to be relevant in long events after 20 years old as lack of experience might be a confounding variable for athletes 20 and under.
There might be other confounding variables that emerge at a certain threshold but for now, we can confidently say that the factors—age, reaction time, and height–all have an impact on swimming performance with varying degrees depending on the length of the event.
Comments