Who is the Most Consistent NBA All-Star?
- Bruin Sports Analytics

- Jun 8, 2021
- 15 min read
By: Terrence Liu and Oscar O'Brien
Introduction:
The National Basketball Association (NBA) selects all-star players every year to highlight the success of individual players. Players are named all-stars through voting from fans, current NBA players, and the media. Looking over the list of this year’s all-stars, every player has a respectable surface-level stat line of points, rebounds, and assists per game. However, per-game averages may not tell the whole story about a player because they may lack consistency: a player could be a shooter that only gets hot for a short time and average the same number of points as a player that has very little variation in scoring. For example, Zach Lavine on the Bulls has scored more than 30 points in 24 games this season, but he averages fewer than 30 points per game, so he must have games where he scores less than his average to balance out his high scoring nights.
The purpose of our article is to analyze the consistency of the 2021 NBA all-stars. We will use the spread of the metrics box plus/minus, game score, and true shooting percentage to get a better idea of a player’s entire game performance. Box plus/minus (BPM) is a rate statistic meaning it will not be affected by how much a player played in each game. Game score was created by John Hollinger to summarize a player’s productivity in a game with a variety of box score elements. True shooting percentage takes into account the value of free throws, two-point baskets, and three-point baskets to give a better representation of how well a player shot. Additionally, this article will look for a possible relationship between player consistency and team success. All of the data in this article comes from basketball-reference.com and all game data is from games that occurred before April 12th.
Exploratory Analysis:
Box Plus/Minus
As mentioned previously, box plus/minus (BPM) is a rate statistic that summarizes box score information. The metric’s creator Daniel Myers explains that BPM “estimates the player’s contribution in points above league average per 100 possessions played” (link). For reference, a BPM of zero means a player performed at the league average, and anything around 10 means the player performed very well in that game. One potential downside of BPM is that it does not account for minutes played. However, this article only considers NBA all-star players, so all of these players play a considerable amount in each game when they are healthy. The players are grouped by position in the following three sets of boxplots to make the data more manageable and to make comparisons more accurate.

The box plot above shows box plus/minus for the six all-star centers in the NBA. Immediately, Nikola Jokic’s median BPM of 11.80 is incredibly impressive because it is higher than any other centers’ third quartile score. This means that Jokic’s 50th percentile BPM is higher than any other all-star center’s 75% BPM. However, Embiid is the most consistent player with his interquartile range being just 6.40. The interquartile range (IQR) is a measure of spread for the middle 50% of the data, which is calculated by subtracting the third quartile from the first quartile. Interestingly, Embiid is the most consistent player by IQR, but he also has five outlier points, which is the most out of all of the centers. On February 19th, Embiid scored 50 points and secured 17 rebounds in a win over the Chicago Bulls. In contrast, on January 14th, he scored only nine points in a win against the Miami Heat even though he played for nearly 24 minutes. One interesting note is that Sabonis’s first quartile is less than zero, meaning when this data was collected, 25% of his games have BPMs below the league average. In this article, we measure the most consistent player in each position category according to the smallest IQR value for that metric because their game production varies the least by game. However, it is still important to note players with incredible stat lines even if they have higher variation in each game because it highlights how there is still variation in the averages between all-stars. Additionally, it shows how performance consistency does not directly correlate to team success because a player with a greater game performance spread could still generate a higher value for any given statistic on average than a more consistent player.

Moving to forwards, the graph above shows BPM for the 11 forwards named all-stars. Luka Doncic leads the group with the smallest IQR of 5.85. Interestingly, Doncic has more outliers than any other forward, similar to how Embiid had a high number of outliers. These two players are clearly very consistent a majority of the time, but will still have good and bad outliers occasionally. Strangely, only eight points separate Doncic’s best and worst games in terms of BPM. He scored 34 points on an efficient five of nine from three in a win over the Charlotte Hornets when he was one assist short of a triple-double and had a BPM of 25.2; Later, in a win over the Minnesota Timberwolves, Doncic had 26 points, but was one of seven from three and had seven turnovers. These two data points show how BPM is a stat that better describes a player’s overall performance than just simply points scored. It should be noted that none of the medians for this group of data are greater than 10, which emphasizes Jokic’s dominance this season. Additionally, Lebron James is the only forward to break 30 BPM in a game, which he achieved with a 46 point scoring affair over the Cleveland Cavaliers. James’s median BPM is also the highest of this group, which is incredible given his age compared to most of these other players. Looking at the inconsistency of some of these players, Jaylen Brown, Paul George, and Ben Simmons all have first quartiles that are less than zero like Sabonis from the list of centers.
The graph above compares the BPM of the last group of all-stars, the 10 guards. This group, like the forwards, does not have anyone whose median BPM can compete with Jokic’s greater than 10 median value. Stephen Curry leads this group with a median BPM of 7.9. Curry and James are not quite ready to give up the reins to a new set of younger superstars. However, when looking at per game consistency, Bradley Beal edges out Curry’s IQR by 0.05 BPM to earn the title of the most consistent all-star guard with a 9.65 IQR. Though, in terms of consistency, Beal does not have any outlier games, which could not be said for Embiid or Doncic. Unlike the centers and forwards, the guards are the only grouping of players where the all-star with the lowest IQR has a first quartile value less than zero. Since guards tend to be the smallest position in basketball, a greater reliance on perimeter shooting is a possible explanation for larger variability in BPM values. Another note is that through April 11th, no all-star guard had broken the single-game 30+ BPM value, which was seen one time by the centers and forwards. However, Donovan Mitchell’s 29.3 BPM in a blowout win over the Orlando Magic nearly broke the 30 BPM threshold. While this article focuses on consistency, it is interesting to compare the range of values produced across positions to see how a metric might value a stat more commonly generated by some positions. In this case, BPM values offensive rebounds equally with assists and steals and defensive rebounds and blocks are about half as valuable. Rebounds and blocks are easier for forwards and centers to generate based on their taller statures, and rebounds especially are very often found alongside points when a player has a double-double in a game. Another note is that a player cannot log points and an assist on the same offensive possession, which is not true for points and rebounds (also rebounds can occur on defense). As a result, the BPM statistic could slightly inflate BPM values for centers and forwards; this can be seen through the preceding graphs none of the 10 guards had a 30+ BPM game, but a forward and center were able to achieve the feat.
Game Score
Game score is another metric similar to box plot minus that tries to summarize a player’s game performance to a single number. It is computed with points, field goals, free throws, rebounds, steals, assists, blocks, fouls, and turnovers. Unlike box plus/minus, this statistic does not account for playing time, so all-stars that play more minutes will have more time to fill the box score. This metric is not normalized around zero like BPM. A score of 10 indicates that a player had an average game, while a game score of 40 means they had a great game.

The graph above shows the game score box plots for the six all-star centers. This metric gives the most consistent all-star center award to Rudy Gobert of the Utah Jazz with an IQR of 7.1. Consistency makes sense for a player like Gobert because he is not a player that is single-handedly going to torch an opposing team offensively. However, his presence is clearly felt in games because he is averaging a double-double with nearly the same average amount of points and rebounds per game with 14.3 and 13.5, respectively. Moreover, his length and effort on the defensive end have earned him two defensive player of year awards. Another note is that Gobert’s median game score of just over 15 is the lowest in the bunch and his 75th percentile is less than 20. Every other player on the list at least has their third quartile above 20, and Jokic has his entire IQR above 20. More evidence of Jokic’s reign of terror around the NBA this season is that he has games with game scores of just over 40 that are not considered outliers by the boxplot. Only Embiid has had two games with a game score of greater than 40, but it should be noted that Embiid is the only center that broke a game score value of 50 with one of his two 40+ games.
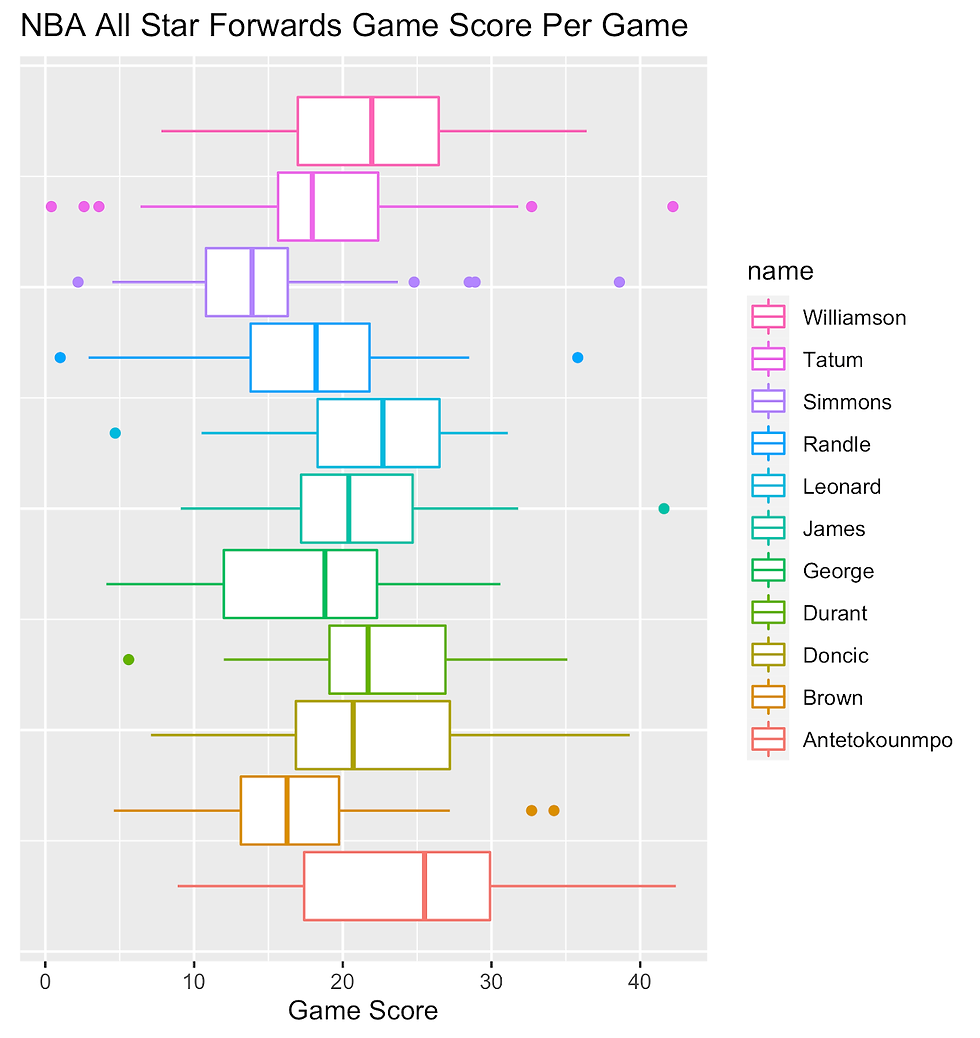
The most consistent player of the all-star forwards is Ben Simmons with an IQR of 5.50. Similar to the centers above, Simmons has the lowest variation in the middle 50 percent of his data in addition to having the lowest median value. Looking at more recent data, Simmons scored between 10 and 19 points in 40 of the 58 regular-season games he played in. He is similar to Gobert where his points per game average is not outrageous, but he is also producing about seven rounds and seven assists per game on an efficient 55.7% from the field to round out a quality stat line. The most inconsistent player, including outliers points, is Jayson Tatum. He is a player who can earn a game score of 42.2 with a 53 point performance, and also a game score of 0.4 with more than 20 minutes of playing time. However, Tatum is one of three players on this list that cracked a game score of 40. Lebron James and Giannis Antetokounmpo are the other two players on this shortlist. Antetokounmpo is the Jokic of this list because a game score of 40 is within range of his IQR to not be considered an outlier. At the conclusion of the regular season, he posted 10 games with a game score in the 30s and three games with a game score in the 40s. His ability to affect so many areas of the game with his combination of size and athleticism make a box score stuffer, which equates to remarkable game score results.

Finally, considering the game scores per game of the guard all-stars based on the graph above. This metric supports the trend from the two previous groups where the most consistent player based on IQR also has the lowest median game score value. That player is Mike Conley of the Utah Jazz with an IQR of 7.25. Visually, Conley has a much smaller IQR box on the plot above than the other guards in the group since no other guard has an IQR less than 10. Another noticeable feature of this graph is the similarity between Stephen Curry and James Harden’s box plots. Their mean values appear almost identical with Curry edging outing Harden by just 0.05. These two are also members of the 40+ game score club with Bradley Beal and Damien Lillard. This is the first grouping where a game score value of 40+ is not considered an outlier for two players, namely Curry and Harden. Although, Curry still had an outing of 62 points that produced a game score of 46.8 that is an outlier even by his high standards. Based on the game score plots of the centers, forwards, and guards, it makes sense that the player with the lowest median game score value also has the most narrow IQR because their middle values are most easily replicated.
Summarizing the Box Plus/Minus and Game Score Rankings by Position
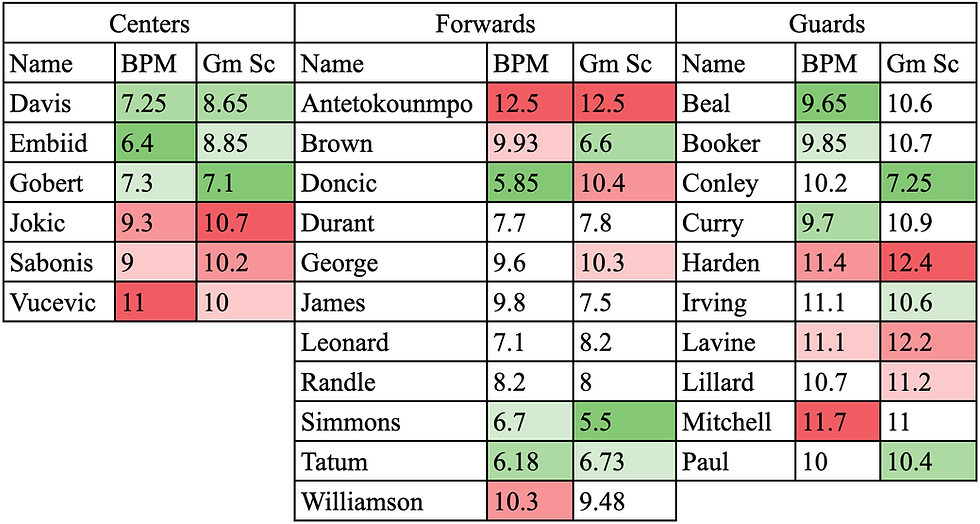
The table above summarizes the IQR results for each player grouped by position. The green cells in each column represent the most consistent players by that metric; the red cells are the three least consistent players. The IQR results for BPM and game score agree with each other for the centers. The three most consistent players for one statistic are the same three for the other one, but the order within the top three changes. For the forwards and guards, BPM and game score mostly agree with each other. It is not the case that the top three and worst three for each metric match, but there are more players in these groups compared to the six centers. The two strangest cases are Luka Doncic and Jaylen Brown, who are in the top three players for one of statistics but are in the worst three players for the other one. Doncic is an especially odd case because his game score IQR is almost five points higher than his BPM IQR where most players only see a one to three-point difference.
Based on the relative rankings of BPM and game score for the three-position categories above, it is possible to take an average of both rankings to assign the most consistent player award at each position. For the centers, there is a three-way tie for first place between Anthony Davis, Joel Embiid, and Rudy Gobert. For the forwards, Ben Simmons is the outright leader. Finally, Bradley Beal is the most consistent guard, although it is not immediately clear, with an average position ranking of 2.5.
Regression Analysis
Knowing a player is consistent definitely brings value, but it makes more sense to see whether it is related to team success; after all, championships are the most important part of each team and individual player’s careers. Therefore, I decided to conduct a linear regression for the different variables that we employed in previous segments, mapping those variables against the win rate for each player’s respective team. In addition, I did not group players based on their position and conference, but simply applied the model to all the players together for the purpose of understanding the relationship between consistency and win rates, rather than which individual player excels. I chose to switch the metric from IQR to variance as well because it better reflects the entire dataset with the outliers being taken into consideration. We used IQR for our earlier analysis because it presents a better visualization of a player’s performances with a box plot and it better captures individual games. Variance is better in this case because some players do not have outliers, and if we ignore that factor, their consistency might be understated; this also means that if we ignore outliers, some players with low IQR and many outliers may have their consistency overstated.
Game Score
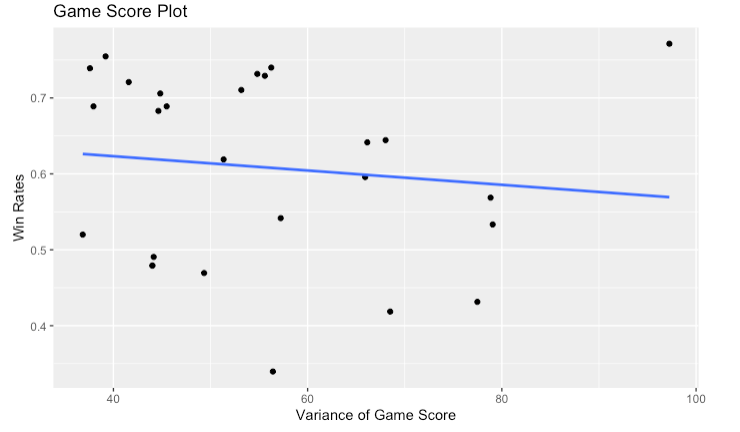
Game score, again, evaluates all the basic statistics of each player, so it clearly resembles each player’s technical prowess and overall effectiveness. In the plot, however, we are seeing a weak (almost nonexistent) negative correlation between win rates and the variance of game score; this implies higher win rates are correlated with lower variance of game score. Specifically, R2, which is the percent of variation in the response variable explained by the explanatory variable, is extremely low at 0.01382; to make it simpler to understand, the response variable in this case is the win rates, and the explanatory variable is the variance in game score, meaning we want to measure how game score affects win rates. This statistic seems surprising at first glance, because we may assume star power can carry their teammates over the hurdles. While it is perfectly plausible that team coordination and strategic adaptations can be the determining factor to a team’s success, it is rather impossible to measure the nuances of teamwork, so we can only suspect that it might be the case.
Box Plus/Minus

Box Plus/Minus (BPM) is yet another advanced statistical tool to measure a player’s effectiveness, so I plotted the variance of each player’s BPM in each game against win rates, similar to game score, in order to see whether there is a correlation between the two variables. There exists a weak (almost nonexistent) positive correlation between win rates and the variance of BPM that can be seen on the graph, as points are very distantly scattered around the regression line. The R2 indicator is slightly higher at 0.09546, which still indicates a very weak correlation. In a similar fashion, the statistical result suggests that individual consistency (measured by variance) doesn’t have much to do with team performance.
Side Note
To prevent the model not being the best way of estimation, I have also checked the residual plots for both of the variables, and it appears that the residuals are randomly distributed around the zero-line. Showing a correlation can mean the necessity to switch models, but the lack of correlation, in our case, simply means that the model itself is not an incorrect selection to fit the data themselves.
True Shooting Percentage
True Shooting percentage is a very interesting statistic that measures the pure mechanical capability of a certain player; after all, basketball is all about putting that ball into the basket. It might be tricky to look at the graphs themselves and see that there are true shooting percentages over 100 percent. This is, first of all, using a higher percentage for 3-point shots (150%) and “and-one” shots (104% for 2-pointers and 139% for 3-pointers); it also takes into account that it is rarely estimated based on a small sample size. True shooting percentage is usually calculated across an entire season as a “per game” statistic. Additionally, because a player’s impact on the court is not exactly measured by shooting, we decided to put this statistic in a separate category, and conduct all the operations we have with the other two variables.

This boxplot displays the true shooting percentage for all-star forwards. Zion Williamson, specifically, appears to fit the criteria of consistency very well. He has a very high median (50 percentile), higher than many players’ third quartile score. Additionally, he appears to have no outliers, meaning that although he rarely overperforms, he does not underperform either. Judging by the interquartile range, however, Giannis Antetokounmpo appears to be the most consistent player (IQR at 9.95 percent), although having four outlier points that both represent his overperformance and underperformance. Overall, the forwards do not display a great variance in true shooting percentage; we neither see a player that simply performs better than the rest nor a player that struggles to compete with the rest.

In the boxplot for guards, we can see that it is even harder to recognize who is the most consistent. Almost all of the all-stars have a mean true shooting percentage at around 60 percent, with the exception of Stephen Curry and Kyrie Irving, who have relatively higher true shooting percentages compared to their peers. Specifically, Stephen Curry’s median true shooting percentage is much higher than most other players, higher than some players’ 75 percentile shooting percentage. He also doesn’t have outliers, meaning a consistent performance in terms of shooting, which we are all accustomed to. James Harden, however, is the most consistent player based on the interquartile range at 16.5 percent. The 0-value game he has can be ignored since he left the game after only 4 minutes in the game due to a hamstring injury. Comparably, guards appear to have closer medians with each other, but a larger IQR over the forwards.
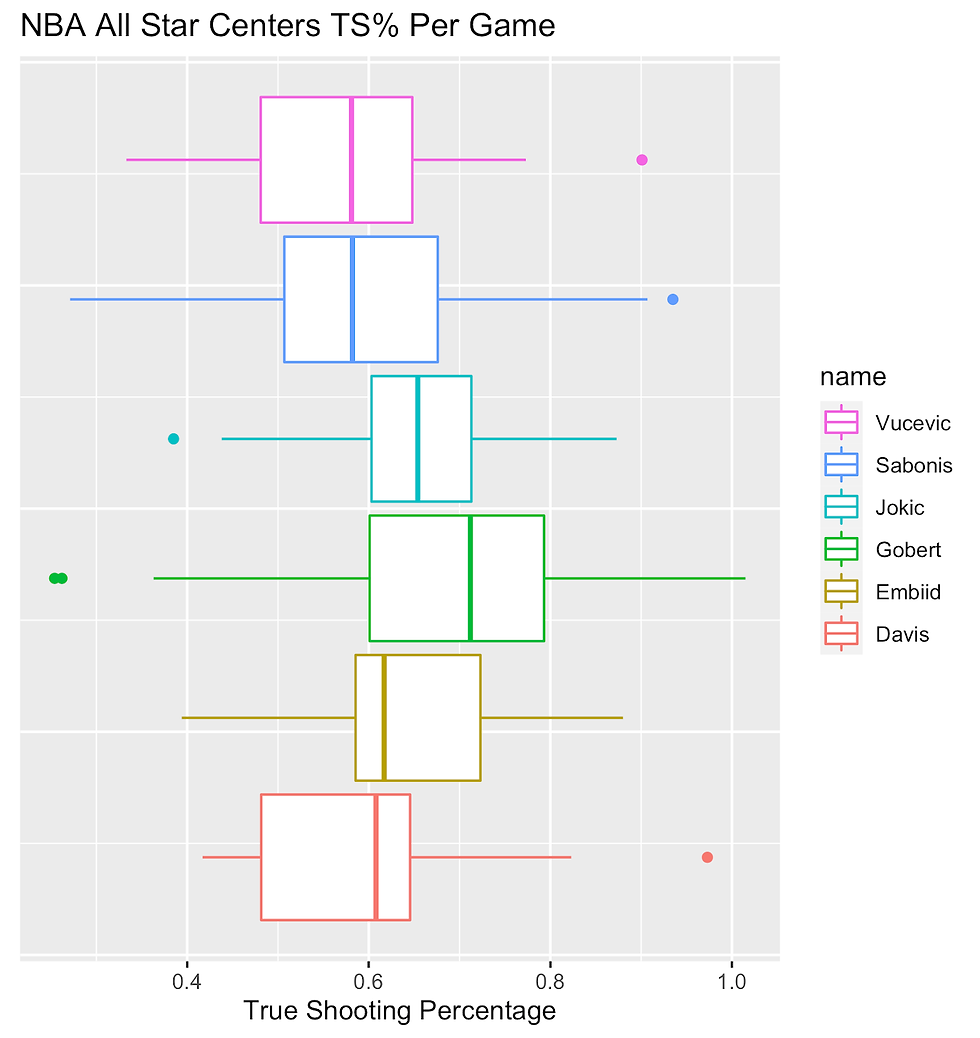
In the box and whiskers plot for centers, we immediately notice the variations in True Shooting percentage largely vary between the players. Notably, Rudy Gobert, who struggled in the Game Score and BPM categories, has the highest mean true shooting percentage over the rest of his peers. The median is either higher than or on par with other players’ 75 percentile. This phenomenon could be attributed to his tendency to shoot more effective shots (dunks and layups), where his primary role is as a rim protector and defender. Other centers such as Anthony Davis and Nikola Vucevic, who have relatively lower true shooting percentages, play mostly from the midrange and attempt a lot of 3-point shots. In terms of IQR, Nikola Jokic stands out as the lowest at 13.75 percent, meaning that he is the most consistent.
Linear Regression
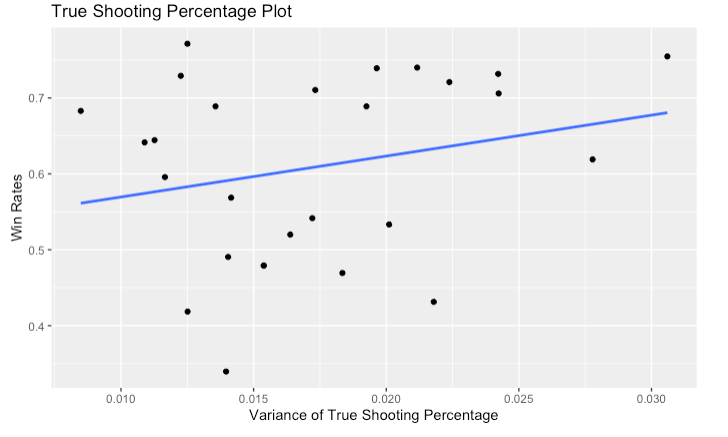
Similarly, I also conducted a linear regression model on the true shooting percentage. Again, this is also after determining that the residuals are randomly distributed around the 0 line (meaning the model is not flawed to fit the data). From the graph, we can see a weak positive correlation between the data points, with an R2 value at 0.057. One thing really interesting about the graph is that we see many data points around the variance around 0.015. While there could be players with extremely high win rates with a low variance, there are some with extremely low win rates as well.
Conclusion
Looking at the results above, it is clear that there is some degree of consistency difference between all-star players, which makes sense due to factors like a player’s health, age, and role on the team. With box plus/minus and game score, the most consistent players tended to be those with lower to average typical game performances. Ben Simmons and Bradley Beal were the most consistent forwards and guards, respectively, and their median BPM and game score values tended to be at or below the overall median of the groups. This trend makes sense because someone like Jokic or Lavine scoring 40+ in a particular game is not sustainable for an entire season. A consistent player is someone who has an average that is realistically reached in every game and rarely deviates too far from that value. The final result with the group of centers was less clear-cut as Davis, Embiid, and Gobert all tied for the most consistent player. Due to the smaller group size, it was easier for the relative rankings of BPM and game score to be closer. However, the trend continued from above in which these consistent players had median BPM and game score values around the middle of the pack for the all-star centers.
When looking at the linear regression model between win rates and these different variables, we struggled to find a strong correlation between consistency and win rates. The strongest correlation we do see is in the Game Score plot, which could potentially be attributed to the inherent meaning of the statistic, which is to how good a player’s individual performance is in these games. BPM and True Shooting percentage doesn’t really show much of a correlation; in fact, the positive relationship means that the higher the win rates, the more variance there is. This, indeed, doesn’t really make sense, as players with smaller variations are considered consistent.
Sources: basketball-reference.com


Comments