College Basketball Conferences
- Bruin Sports Analytics

- Apr 4, 2023
- 9 min read
By: Memphis Lau
Every year, once March comes around, we all fill out our brackets, most of us doing so blindly and without knowledge of how exactly the tournament works. This article aims to explain how conferences play into the tournament, determine which conferences are worth watching, and explore trends between high-major conferences and mid-major conferences. Our dataset contains data on the last 9 tournaments (10 seasons, because there was no 2020 tournament).
How Do Conferences Work?
In Division I College Basketball, there are 352 teams, each placed into one of the 32 conferences (or leagues) around the nation. These designations are mostly regional. They dictate a team's schedule, as they will play a majority of its games throughout the season strictly against teams in its own conference.
At the end of the season, every conference has a tournament within itself, with seeding based on the teams' records against each other in league play. The winner of these tournaments wins a guaranteed spot into the now 68-team March Madness bracket and a chance to win the National Championship. That means 32 of the 68 teams in the tournament are locked first. The other 36 teams are chosen from any conference in the nation, chosen by a panel.
This means every conference will be represented by at least one team every year.
Conference Watch


We see that the number of teams represented in the data is relatively standard throughout all the different conferences. However, the number of teams that have made the tournament spike in 6 conferences. The same happens when we look at tournament teams that have made the sweet 16 or better.
These 6 conferences are known as "high-major" conferences. They are the Big 10, the Atlantic Coast Conference, the Big 12, the Big East, the Southeastern Conference, and the Pac-12 Conference. I will refer to these high-major conferences as Power 6 Conferences, as well.
More importantly for us, UCLA belongs to the Pac-12. However, in a couple years, UCLA will move conferences to the Big Ten.
I: High Major Conferences vs Mid Major Conferences

This table shows us that high-major teams simply are better on average than mid-major teams. Across all significant statistical factors, high-major teams have mid-major teams beat. They have a higher offensive efficiency, while having a better defensive efficiency, as well. The graph below helps us visualize this better. They turn the ball over less. However, shooting numbers are relatively even. The largest difference is in the BARTHAG score: their power rating (chances of beating an average DI team). The averages between the two types of conferences differ by almost 48%.

As we can see, a Power 6 team on average has better adjusted offensive efficiency and defensive efficiency than a mid-major team. Not coincidentally, when we plot the same parameters and separate them by tournament teams and non-tournament teams, the graphs are strikingly similar. It leads us to exploring the disparities in the postseason.
A. Postseason Consistency

This graph shows how many teams have made the tournament at least n times in the last 9 years (for 5 <= n <= 9). We see that there are many more "consistent" teams in high major leagues. This is made even more significant by the fact that the dataset has more than 3 times more mid-major teams than high-major teams.
B. Seeding in the Tournament
The average seed for a high major team in the last 9 tournaments is 5.934, while the average seed of a mid-major is 11.905. In fact, less than 20% of tournament high major conference teams are seeded 10 and below, while over 75% of mid-major schools are. As by the nature of the tournament, it is much more difficult to advance far if a team is seeded lower.

This graph reveals interesting patterns in tournament seeding with regards to high major teams and mid major teams. There are spikes in the amount of 11 seeds and 16 seeds because there are 6 of each in every tournament, as opposed to the 4 of every other seed.
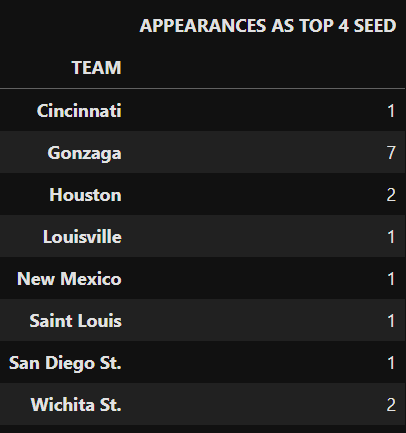
It is interesting to see that no high major team has been seeded 13 or worse in any of the past 9 tournaments. Another takeaway from this graph is that the peak of the ratio of high major teams at the seed is at the 3 seed line, instead of the 1 seed. As we will see later, this is because a couple mid-major teams (Gonzaga and Houston) often are 1-seeds.
C. Postseason Success

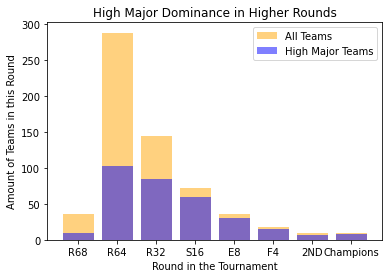

As expected, because of the higher seeding and better play, high-major teams are much more likely to make it far in the tournament.

Plotted here are the results of every team seeded 6th or higher, separated by high major vs mid major. The numbers on each bar represent the proportions of each result to account for the disparity in the amount of high seeded teams.
As we can see, mid-major teams are more likely to get upset in the first two rounds, with 68% of them doing so, compared to the 48% of high major teams losing in the first weekend. This could be because mid-majors typically do not get the opportunities to play against good opponents during the regular season. If they were high-seeded, then they probably dominated their conference and had a lot of wins there. Once they get into the tournament, they are matched against power conference schools that have been playing against real competition their entire season. "Upsets" are bound to happen under this circumstance.
II. Mid Major Outliers
As we can see in all of our plots, while high major teams dominate postseason consistency, seeding, and success, there still are some mid-major teams that have performed well over the last 9 years.


A. Gonzaga Bulldogs
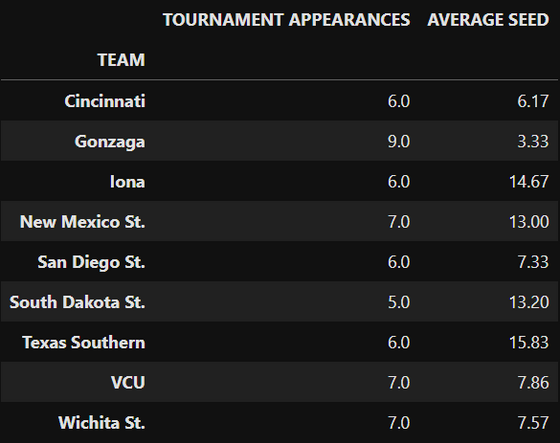
Clearly from our table, Gonzaga seems to be the most impressive mid-major team. We will take a closer look at this outlier.

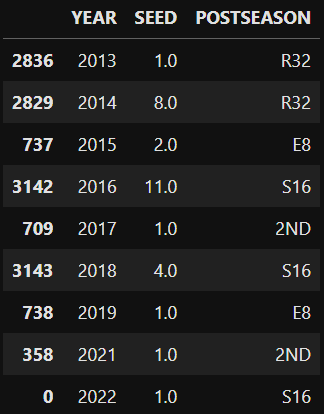

Though Gonzaga has not won a national championship in recent history, it has consistently been a national powerhouse despite coming from a mid-major conference. With a student body of under 8,000 students, Gonzaga puts the majority of its focus and resources into its basketball program. Coached by a future Hall of Fame coach in Mark Few, Gonzaga maintains its success through strong recruiting classes and veteran players. Only once in the last 9 tournaments has Gonzaga been a double digit seed, which we saw is very common for mid majors. Even then, Gonzaga made it to the Sweet Sixteen that year.
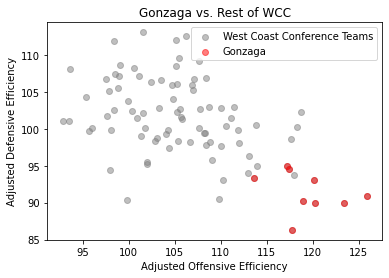
The right plot shows that Gonzaga has dominated the West Coast Conference for the last decade, serving as the outliers in adjusted offensive and defensive efficiency in the conference. Though the data only shows the past 10 years, Gonzaga has actually been dominating this conference for many decades.
B. Houston Cougars

As we can see, Houston has been on the rise for the last 5 seasons, having made the tournament as a high seed each time. Houston's defense has become one of the strongest in the nation, allowing them to match up with high-major teams when it matters.
However, as happens with many successful mid-majors in past history, Houston is planning to move into a high-major conference (the Big 12) next year to match up with better competition.
C. Mid-Major Successful Teams

Above is a chart of all the mid-major teams that have made it to the elite eight or farther in the last 9 years. The only schools that have done so more than once are Gonzaga (4) and Houston (2). Every other team has been a miraculous Cinderella story without any consistency. The only team to have won the entire tournament is the University of Connecticut (UCONN) from the American conference in 2014. However, UCONN later joined a power conference in the Big East shortly after.
As we explore mid-major teams, it becomes more and more clear that Gonzaga is simply an outlier. No mid-major team will be able to maintain consistent success like Gonzaga has. Houston seemed to be a potential competitor, but it is moving to a power conference soon.
D. Cinderella Teams
In this section, we will explore mid-major Cinderella teams and whether they share common statistics. My definition of a Cinderella Team is a team seeded 9th or worse making it to the Sweet 16 or better. Doing so would mean they have to beat a higher seed in the first round, then win at least another matchup. A team that is seeded as a 9 seed would have to beat the 1 seed to advance to the Sweet 16, so I included them in my definition of a Cinderella team.

There have been 8 Cinderellas in the last 9 tournaments, with the most recent two being 15 seeds. We will compare their stats with other mid-major teams seeded 9th or worse to see if there are any patterns in these specific Cinderella teams.

We see that the mean stats for Cinderella teams are very similar to those of non-cinderella teams. The only difference is that on average, Cinderella teams have a better offensive and defensive efficiency, which coincides with our previous findings that teams that go far into the tournament typically have higher offensive efficiency and lower defensive efficiency. So, when picking your bracket, if you want to find a Cinderella team to support, adjusted offensive and defensive efficiency are the stats to look at.
III. Relevancy to Us
We have explored the differences between high-major schools and mid-major schools. However, it is not as relevant to us Bruins, as UCLA will never be a mid-major school. Now, we will look into the last 9 tournaments for the Pac-12 (UCLA's current conference) and the Big Ten, the conference that UCLA will move to in 2024.
A. Pac-12
The Pacific-12 has been one of the worst power conferences recently. Over the last 9 tournaments, they have only sent an average of 4.44 schools each season. Over that same span, each of the other 5 high-major conferences have sent more teams.


We see that the average adjusted offensive and defensive efficiency for teams in the Pac-12 ranks worst amongst power conferences in the past 10 years. So how has the Pac-12 retained relevancy?
Arizona, Oregon, and UCLA have been relatively consistent tournament teams, each making it 7 times in the last 9 postseasons. In addition, they typically seed relatively high, with Arizona being an outlier in this group (average seed of 3.14). However, besides those three schools, no other school is consistent. No other team has appeared more than 4 times in the last 9 March Madness’s. These teams lower the overall status and statistics of the Pac-12. With many other power conferences, there are many more strong teams and less weak teams, as we will see when we explore the Big Ten.
B. Big Ten

The Big Ten sends an impressively high 7 teams to the tournament on average each year. Considering only 68 teams throughout 32 conferences make the tournament, one conference having 7 of them is remarkable. In addition, 7 Big Ten schools have made the tournament at least 5 times in the last 9 years.
Clearly, the Big Ten has stronger and more consistent teams than the Pac-12. Not only will a move to the Big Ten increase profit for UCLA, but it will also expose our team to better competition throughout the season, allowing us to prepare for the tournament.
This season, only 2 Pac-12 teams are in the top 45 in NET rankings (Arizona and UCLA). Within league play, UCLA does not have the opportunity to test itself against other teams that will be in the tournament. Meanwhile, every school in the Big Ten basically plays a tournament-bound team every week. This move to the Big Ten will make travel and some logistics tougher, but in the end, it will give UCLA a higher chance of winning it all.
C. Mid-Majors to Watch This Season
As we saw in our section on mid-major outliers, Houston and Gonzaga are still strong teams that will be seeded high and expected to go far. In fact, Houston has been the number 1 ranked school for about a third of the season.
In our Cinderella section, we saw that Cinderella teams tend to have better adjusted offensive efficiency and defensive efficiency. Here are some notable mid-major schools that are top 50 in either adjusted offensive or defensive efficiency, and above average in the opposite (per KenPom):
- Florida Atlantic (Conference USA)
- Memphis (American Conference)
- Utah St. (Mountain West Conference)
- New Mexico (Mountain West Conference)
- San Diego St. (Mountain West Conference)
- Charleston (Colonial Athletic Conference)
- Saint Mary's (West Coast Conference)
- Boise State (Mountain West Conference)
If they make the tournament, look for these schools to exceed expectations.
Update: Two of the mid-major schools I had mentioned above (San Diego St. and Florida Atlantic) made the Final Four, and San Diego St. made it to the National Championship.
IV. Conclusion
In this article, we explored how conferences work in college basketball, and what high-major conferences are. We saw the differences in mid-majors vs high-majors in both the regular season and March Madness implications. We then looked into mid-major outliers and what makes a "Cinderella" team. Lastly, we discover why UCLA is moving from the Pac-12 to the Big Ten and present mid-majors that could make noise this March.


Comments