Home Runs in the Air
- Bruin Sports Analytics

- May 25, 2019
- 7 min read
By: Alex Veroulis
Every year, it seems that home runs become more and more prevalent in the modern version of Major League Baseball. After all, in recent years, more players seem to be following the Three True Outcomes when they go up to hit: a strikeout, a walk, or a home run. These outcomes seem rare because they do not require the involvement of any defensive players besides the pitcher and catcher; however, hitters are making these outcomes more common due to an increased motivation to hit home runs. Analytics in the past several years have advocated for batters to try to hit more home runs with the end goal of increasing the expected amount of runs scored; players and managers alike have been heavily influenced by the analytics revolution, as they want to gain any kind of competitive advantage they can. In fact, players are following these analytics to such an extent that they are sacrificing batting average and on base percentage as a direct result of strikeouts; as players try to hit the ball farther, they are more likely to swing and miss, which explains the uptick in strikeouts.
With this drastic increase in long balls, some analysts have decided to focus some attention on perhaps one of the "easiest" places to hit homers: Coors Field in Denver, Colorado. Due to the mile-high altitude in Denver, the home of the MLB's Colorado Rockies, people often say the ball travels farther than usual due to the thin air.
Although thinner air is known to provide less resistance against a ball in flight, thus allowing for more carry, this has not been substantiated by proper evidence. Thus, I carried out a hypothesis test to examine whether hitters are truly taking advantage of the thinner air in Denver versus other venues. To do this, I identified and analyzed veteran hitters with these qualifications: they played at least 2 seasons with the Rockies and at least 2 seasons with another team, they played in the big leagues for at least 6 years, they were not pitchers, and they had at least one season with more than 5 home runs. This ensured that I could compare home run statistics between sizable samples for seasons with the Rockies versus seasons without them, and I could have presumably less volatile data with veterans who have more established careers. Once this was done, I found the average home run total with the Rockies using the data for the veterans' time with the Rockies and do the same for their time on other teams. I did this by taking the total home run counts and dividing them by the number of player seasons. Since some seasons are shorter than others due to injuries and other issues, I accounted for this issue by taking the total number of games played and dividing it by 162 (games in a full season) to obtain a more accurate measure of seasons. Then, I compared these averages and made a determination as to whether or not the average home runs hit with the Rockies versus the home run average on other teams is large enough where we can say that hitters are truly taking advantage of the thin Colorado air.
For starters, out of the 564 players in the history of the Rockies franchise, I referenced the Rockies' team site to look at the tenures of all the players with the Rockies, other teams, and in the league overall. In the end, I manually identified only 37 players that met my qualifications. The vast majority of these qualified players were ones I had heard of before, but there were a handful that were playing long before I was born. I then went to baseball-reference.com to examine the hitting statistics for each of these 37 players, and after some web scraping and data processing, I added up their home runs, games played, and seasons played for their careers in Colorado in one table and did the same in another table for time played elsewhere. Here is what I found for time played in Colorado:
Over the course of 16226 games played, hitters who played for the Colorado Rockies hit a grand total of 2266 home runs. Now, this was over the course of 160 seasons, but to get a more accurate measure of seasons by dividing games played by 162, I got a smaller total of roughly 100 seasons. To find the average number of home runs hit per season, I divided the total home runs hit by the full seasons played; ultimately, I found that this group of players averaged roughly 22.6 home runs per full season, which is a little higher than what I expected, especially when considering the results for the players' time with other teams. Here is what I found for their hitting statistics elsewhere:
Now, this was a much larger sample size with 33427 games played and a little over 206 full seasons played elsewhere. So, we obtained a higher raw total of home runs with 3593 dingers, but after averaging this value, we find that this group of hitters averaged roughly 17.4 home runs per full season elsewhere, which is quite the drop-off from their statistics in Colorado. In fact, the difference in average home runs per full season turned out to be +5.2 HR/season in favor of Colorado. To further examine this difference, I looked at a couple of visuals to see the difference in home run distributions for both scenarios:
These graphs represent all of the individual home run totals per actual season played, which means that I left the data as is and didn't normalize seasons with low game totals. So, some bubbles might be misleading because they are lower than they should be, but the graphs should give the reader an accurate portrayal of the differences between hitters playing for Colorado versus playing elsewhere. Clearly, there are a lot more seasons in the elsewhere graph where hitters aren't eclipsing 10 home runs. Numerically speaking, roughly 60% of seasons elsewhere resulted in a season with less than 10 home runs, in comparison to a 49% figure for Colorado. Also, despite the discrepancy in sample size in favor of the elsewhere graph, the Colorado graph actually has more 30+ HR seasons (23) than seasons elsewhere (18). Clearly, hitters playing for Colorado seemingly had the upper hand when it came to long shots. This idea is further emphasized in a couple of boxplots comparing the two scenarios.
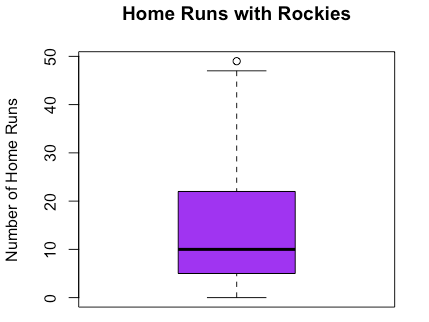
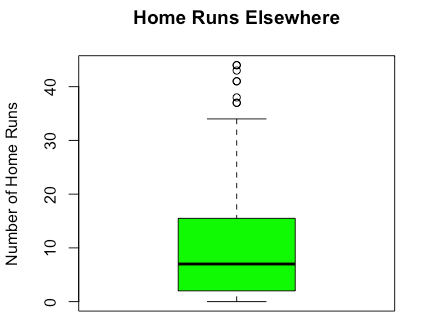
Here, we have a couple of boxplots that further emphasize the discrepancy in home run totals between the two scenarios. Again, these visualizations represent home runs in each actual season, so I didn't manipulate these graphs in any way. Through a quick observation, one can notice that there are more outliers (denoted by circles) in the elsewhere graph, which means that it was more unusual to see home run totals above the highest whisker (horizontal line), which was roughly 35 home runs. On the other hand, the highest whisker for the Rockies graph was just over 47 home runs, which is why this higher threshold yielded only one outlier, a 49-home run season by Larry Walker back in 1997. So, even though 35+ home run seasons were unusual outside of Colorado, they were not at all unusual for hitters during their time with the Rockies. Furthermore, by looking at the stripes on the graphs, we can deduce the median home runs hit per season for each scenario. However, since these graphs did not account for full-season (162 game) totals, I calculated median values that accounted for full seasons by applying a multiplicative factor to these medians. For seasons in Colorado, the adjusted median value for home runs hit per season was roughly 15.97 home runs, while the adjusted median dipped down to 12.48 home runs per season. Again, we see that players hit more home runs on average while playing for Colorado as opposed to elsewhere.
The final step of this exploratory analysis was carrying out a hypothesis test for a difference in home run averages between the two scenarios. To do this, I found a t-statistic, which was the difference in home run averages divided by the standard error. In this case, the standard error was found by using the standard deviations of the home runs for the different scenarios and the number of player seasons as the sample sizes. In the end, I obtained a t-statistic of 4.82, and as a result, I obtained a p-value of approximately 0.0000007, which is extremely small. In layman's terms, this 0.0000007 figure represents the chance that the average home runs from the Colorado scenario ended up being as great or greater than the observed difference we had of 5.2 home runs per full season if the averages from both scenarios were actually equal for all hitters. Therefore, since this is such a small probability, we can conclude that, on average, players for Colorado hit more home runs per season than those who play elsewhere.
With this in mind, we can now affirm what many have already suspected: playing for the Colorado Rockies augments an average Major League player's home run statistics by a significant margin. Because of this, hitters in Colorado should be aware that the ball will in fact carry farther than in other venues, so unlike many players today, they should ease up on their swings. Not only can they reduce the likelihood of a strikeout, but they also won't lose much when it comes to their chances of hitting the long ball, especially when you consider the increasing power of today's hitters (just look at Giancarlo Stanton). As for Colorado pitchers, they must keep in mind the increased likelihood of home runs in Colorado, so to prevent home run opportunities, they would be well served to keep the ball low and pitch away from the well-known power hitters. Plus, when it comes to aging veteran free agents who want to pad their stats and make a case for the Hall of Fame, they should consider playing their last days in Colorado, where home runs are easier to come by than elsewhere. Nelson Cruz is a good candidate for the aging veteran; while he has enjoyed great success throughout his career, he should finish his career in Colorado, where he can produce a couple more stellar seasons at the plate and thus immortalize himself among the best hitters to ever live. Overall, Colorado truly is a hitter's paradise.
Source: baseball-reference.com


Comments