Is Defensive Rating a Good Measure of Actual Defensive Ability?
- Bruin Sports Analytics

- Dec 17, 2020
- 10 min read
By: Brian Suk
“Defense wins championships.” If you are an NBA fan, or even just a sports fan in general, you are probably familiar with this phrase. It signifies the importance of the less-highlighted side of the floor that contributes just as much to a team’s success as a flashy dunk, or a 3-pointer. As a result, players are analyzed not only for their offensive contributions on the court, but also on their ability to add to their team defensively. One metric many analysts and fans use to judge a player’s defensive worth to their team is the Defensive Rating of the player. This is a statistic that quantifies a player’s supposed defensive contributions by showing how many points a player allows per 100 possessions when they are on the court. However, how reliable is this statistic in truly capturing the defensive impact a player has, and is it used in the correct context when people analyze certain players? For instance, there are many other defensive stats that one can use to measure a player’s defensive worth, including steals and blocks. Do these different statistics agree with each other in judging a player’s defensive impact, and is there any sort of correlation among them? Through statistical tests and data analysis, I compared multiple different defensive statistics of players in order to examine how useful or accurate the statistic of Defensive Rating was in determining a player’s defensive worth.
First, let’s examine the statistic of Defensive Rating alone for some context on what it is, and what can be considered a “good” or “bad” defensive rating. As stated before, defensive rating formally is the quantitative statistic that measures the number of points a certain player allows per 100 possessions while they are on the court. In simpler terms, it basically means how many points the opposing team scored while a certain player was playing in the game, and then that number extrapolated to 100 possessions. According to basketballreference.com, the average number of possessions taken over all 30 NBA teams combined was 100.3 possessions per game. Thus, we can assume that a player’s defensive rating is very close, if not almost exactly equal to the amount of points an opposing team would have scored had that player been playing for the entire game (i.e.,the total number of possessions of the opposition). Using this approximation, we can therefore determine how “good” or “bad” a player’s defensive rating is by comparing their rating to the typical number of points the opposing team scores. According to basketballreference.com, the league-wide average number of points scored per game in 2019-2020 was 111.8. Since this rate of 111.8 points was scored per 100.3 possessions, and defensive rating is per 100 possessions, we can utilize a mathematical ratio to say that if a player has a defensive rating of approximately 111.47, they are approximately around league average. Players with a rating significantly below this number can be categorized as “good” defensive players, and players with a higher rating can be categorized as supposedly “bad” defensive players. Additionally, the league-average for Defensive Rating was 110.6, so we can apply the same principles here to say that a rating higher than this is “bad” and a rating lower than this is “good.” The bar graph shown below illustrates the disparity and possible range in defensive rating between players. The first five players on the graph from Giannis Antetokounmpo to Joel Embiid are all well known, top tier defensive players, who possess remarkably low defensive ratings all <105. The next five players from DeMar DeRozan to Trae Young are all notoriously poor defenders, and as can be observed they all have defensive ratings way above the league average at 115+. Thus, we can get a general idea of how defensive rating can range between “good” and “bad” defenders below and above the league average of 110.6.

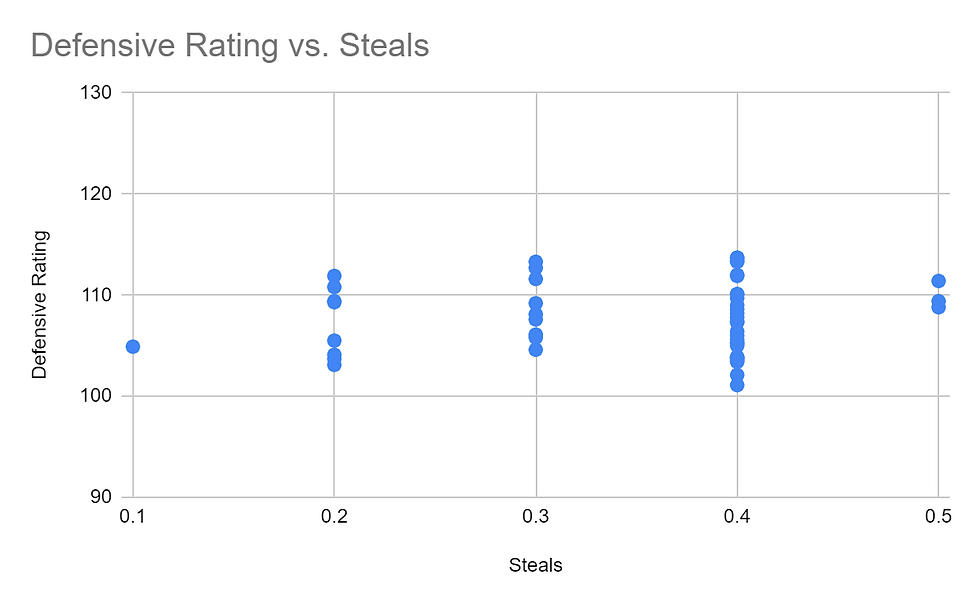
Now that we’ve established the definition and parameters associated with Defensive Rating, we can now move into comparing this statistic with other significant defensive statistics in order to determine if defensive rating is a good representation of a player’s defensive ability, or if it is misleading instead. One significant defensive statistic in basketball is Steals Per Game. It is one of the main major defensive statistical categories in basketball, and is often a heavy indicator of a player’s defensive contribution to the team, thus being a big consideration in a player’s defensive impact. So naturally, a higher number of Steals Per Game should lead to greater defensive impact/ability for a player, at the very least in that specific avenue of defense. I compared the numbers of the top 50 highest Steals Per Game players in the NBA to their corresponding Defensive Ratings to determine whether there was any type of relationship between these two statistics, as shown in the scatterplot below.

As can be observed, there is indeed a pretty significant agreement, as 41 out of the top 50 Steals Per Game leaders in the NBA had a Defensive Rating below the league-average points per game for 100 possessions of 111.47, and only 9 players had a defensive rating higher than this amount. This makes sense, as high Steals Per Game, combined with low defensive rating, are both positive indicators for a “good” defensive player, and since 82% of the top 50 steals per game leaders in the NBA have an above average defensive rating, we can say that for these players, there is an agreement between steals per game and defensive rating, therefore there is also a favorable relationship between defensive rating and defensive impact/ability. Similarly, if we use the league-average defensive rating of 110.6, 39 out of the top 50 steals leaders had a defensive rating below the league-average. So while this is slightly lower at 78%, it is still a pretty strong indicator that there is an agreement between a player’s steals per game and their defensive rating. Thus, in this case, we can conclude that defensive rating is indeed a good indicator of a player’s defensive impact and ability, as it correlates agreeably with Steals Per Game. However, I also proceeded to compare the bottom 50 players in Steals Per Game to their corresponding Defensive Ratings, as shown below.
Here, there was not as much agreement. Only 12/50, a measly 24%, of the bottom 50 players had a defensive rating higher than league-average. This does not agree with our findings for the top 50 players, as less steals should theoretically correspond to a higher defensive rating, but if anything analysis of the bottom 50 players suggests the opposite. Now using these two datasets of top 50 and bottom 50 in steals, we can construct a t-test to see if there is a statistical difference in means between the two datasets. We can set our null hypothesis as there being no difference, and our alternative as there being a difference in means. Since the results of the t-test yield a P-value of approximately 0.202, and using the standard alpha of 0.05, we can not safely reject the null hypothesis and we cannot conclude that there is a statistically significant difference between the two means. This makes sense, as even in the observed datasets, we were able to see that the proportion of players in the bottom 50 of steals did not necessarily have higher defensive ratings than those in the top 50. With this, we can conclude that there is not necessarily a correlation between high steals and lower defensive rating. Thus, the data analysis seems to suggest that defensive rating is not a great measure of a player’s defensive ability/impact alone, as it does not have a favorable correlation with an important defensive metric in Steals Per Game.
Another significant defensive statistic of comparison is a player’s Blocks Per Game. Along with Steals, it is another one of the major statistical categories used to judge a player’s defensive ability and contributions. A higher number of blocks per game should generally correlate to better defensive performance, and thus with a lower defensive rating. Once again, I utilized a scatter plot to compare the top 50 leaders in Blocks Per Game in the NBA to their corresponding defensive ratings to test for agreement.

We can utilize both the league averages for points per game (111.47) and defensive rating (110.6) to search for agreement and make an observation to reach a conclusion. For Blocks, there were 37 out of the top 50 block leaders that had a defensive rating lower than the average points per game per 100 possessions, and 13 that had a defensive rating higher. This is a slightly lower % than we had with steals, with 74% of the block leaders having a lower defensive rating than the average points per game, as opposed to 82% with steals. Nonetheless, it is still a pretty telling proportion, with almost ¾ of the top 50 block leaders having a “good” defensive rating. As for the comparison with the league-average defensive rating of 110.6, there are 35 players who have a defensive rating lower than 110.6, and 15 players with a higher defensive rating. This is the lowest percentage of “good” defensive ratings so far at 70%, but it is still a solid, representative percentage of “good” defensive players. Next, I again compared Blocks Per Game with Defensive Rating for the bottom 50 players in Blocks Per Game.

Similarly to the analysis of the bottom 50 in Steals, there is again not much agreement in blocks and defensive rating for the bottom 50 blocks per game players. Only 14/50, or 28%, of the bottom 50 players in blocks had a higher defensive rating than league average. Again, this does not agree with our findings for the top 50 players, as less blocks should theoretically correspond to a higher defensive rating, which is not the case in our analysis of the bottom 50 players. We can again construct a t-test using the top 50 and bottom 50 in blocks to see if there is a statistical difference in means between the two datasets. Here, we get a remarkably high P-value of 0.897, which clearly shows that we cannot reject our null hypothesis, and we cannot conclude that there is a statistical difference in the means between the two datasets. So once again, although there seems to be agreement between blocks and defensive rating for the top 50 players, when we perform a t-test between both sets of top and bottom 50 players in blocks, there does not seem to be a statistical difference in the means of the two variables, and thus, we cannot conclude that there is a correlation in the two statistics. Thus, as with steals per game, we can conclude similarly that there is not necessarily a correlation between higher blocks per game averages and lower defensive ratings. Once again, the data analysis seems to suggest that defensive rating is not a great measure of a player’s defensive ability/impact alone, as it does not have a favorable correlation with an important defensive metric in Blocks Per Game.
In conclusion, based on the results of these experiments, we cannot conclude that Defensive Rating is a good measure of defensive impact/ability, as it does not necessarily possess correlation with two other major defensive statistical categories in Steals and Blocks. With a higher number of Steals and Blocks, which tend to indicate better overall defensive ability, players should theoretically have a lower Defensive Rating. But based on the numbers, in particular, our analysis of the bottom 50 players in Blocks and Steals, we cannot safely conclude that the means of the two datasets have significantly different means. This can lead us to believe that there is no significant correlation between Steals/Blocks and Defensive Rating. Therefore, we cannot safely say that Defensive Rating is a good indicator of overall defensive impact/ability that a certain player has on their team when they are on the floor. Although this conclusion may seem perplexing at first, if we take these variables and data into context, there are clear possible explanations to this conclusion. Although the raw numbers and tangible data of the statistics themselves are important in reaching statistical conclusions, there are also often several intangible factors we must take into consideration when performing statistical analysis. For example, the minutes played of each player should also be taken into consideration. Players who play a shorter amount of time than other players may not possess a proper sample size that is truly representative of their defensive ability, which could cause them to have a higher or lower defensive rating than they should, causing them to have a defensive rating that is not necessarily representative of their actual defensive ability. In addition, a player could have a lower Defensive Rating than another player not necessarily because they themselves are a better defensive player, but because of the teammates who are also on the court with them at the time. If a player plays with better defensive players around them than another player, they could have a better defensive rating than the other player who plays with worse defensive players. One example of this could be players in the starting lineup who play with better players around them, helping their defensive rating. Conversely, a starting player could also be playing against better competition, thus increasing their defensive rating without actual regard to their defensive abilities. This could be exactly why certain players do not average a high number of Steals/Blocks, but still possess a very low defensive rating. Their individual defensive ability is not great, but due to the players around them, they have a high defensive rating anyways. Finally, one last thing to take into consideration is the fact that a player’s defensive impact is often not always reflected in their statistics. A player may not average a high number of individual steals or blocks, but they can still have a high defensive impact on the court through things such as smart rotations, vocal communication, and strong help defense. None of these are recorded statistics, but their overall defensive impact can still be shown through their defensive rating, even though they might not average a ton of steals or blocks. With those factors in mind, overall, based on the experiment and numbers, we cannot safely conclude that a significant correlation exists between Steals/Blocks and Defensive Rating, so we can conclude that Defensive Rating alone is probably not a good measure of a player’s general defensive abilities. We must holistically consider the context behind the numbers, and analyze a player more closely beyond just their defensive rating to determine their overall defensive impact/ability. The perfect example of why we can't trust defensive rating alone is James Harden: he may have a "good" defensive rating of 108.2, but we can all agree that he is not a "good" defensive player.


Comments